The Rise of El Niño and La Niña
We often get asked how El Niño or La Niña events form and increase in strength. The key is in the ocean-atmosphere coupling across the tropical Pacific Ocean. Without it, ENSO would not exist, and it would be considerably more difficult to predict climate impacts seasons in advance. Various ingredients of the ocean have to be combined with the atmosphere in order for ENSO to blossom and grow. Flour and yeast also would be pretty boring and inert on their own, but when put together, they reinforce each other, the combined product increases in size, and eventually it releases the heavenly scents of fresh baked bread. That’s right, I’m basically saying ENSO is fresh baked bread (Mmm, ENSO, you’re so tasty).
Assemble the Ingredients
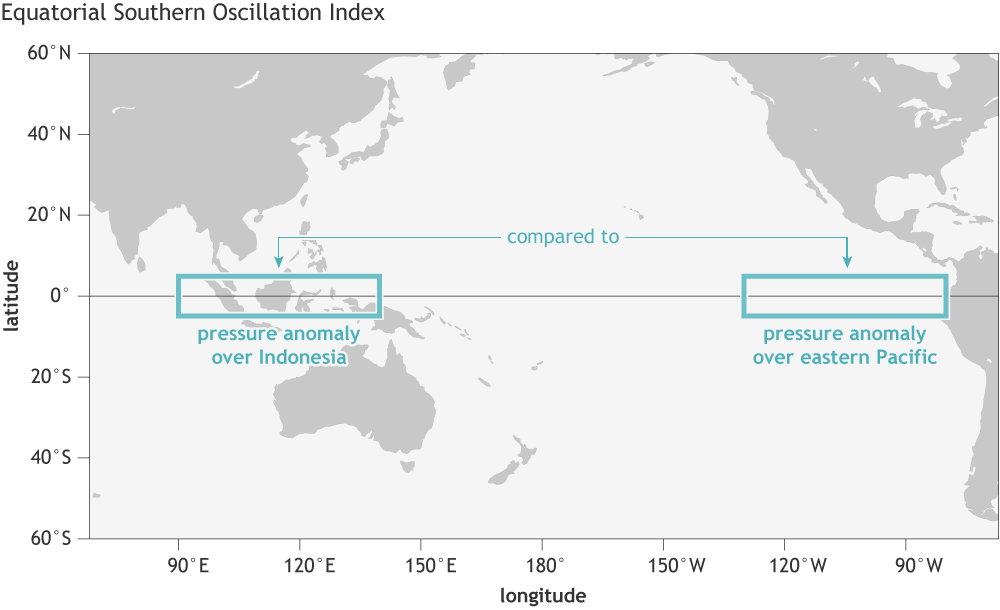
But how do the ocean and atmosphere come together to make the bread ENSO? Good question and, incredibly, this problem took nearly fifty years to solve, even after all of the basic ingredients were uncovered. We have described the Walker Circulation many times before, which is named after Gilbert Walker because he is very important to the field of meteorology and climate. While working in India from 1903-23, he observed “the swaying of [atmospheric] pressure on a big scale backwards and forwards between the Pacific Ocean and Indian Ocean” (Adamson, 2020). He called this large-scale seesaw in pressure the Southern Oscillation to draw contrast with the more northern locales of other climate phenomena he also identified and named, like the North Atlantic Oscillation (yes, same guy!).
Unfortunately for him, at the time, Walker’s discoveries were treated more as scientific curiosities than anything else. No one really knew why the Southern Oscillation existed, and they certainly didn’t grasp the larger implications of his discovery until a guy by the name of Jacob Bjerknes had his “ah ha!” moment in the 1960s (1). By using new satellites and observations from Canton Island in the South Pacific Ocean, Bjerknes was able to link changes in the pressure pattern that Walker discovered with fluctuations in temperature in the tropical Pacific Ocean (2). He brilliantly realized it was all one big system and that the ocean and atmosphere were “coupled,” meaning that the pressure and temperature patterns rely on interactions between the ocean and atmosphere.
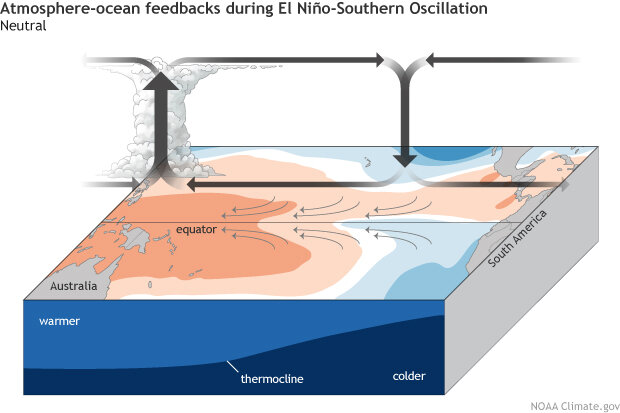
ENSO-Neutral or average conditions across the tropical Pacific Ocean. Climate.gov schematic by Emily Eng and inspired by NOAA PMEL.
As the Dough Rises
But how does this coupling allow ENSO to emerge and grow? The magic is in feedbacks and, in particular, what we now call the Bjerknes feedback.
In climate, feedbacks do not refer to comments on performance reviews or the squeak of a microphone, but rather physical processes that reinforce each other (a positive feedback) or destroy each other (a negative feedback). The Bjerknes feedback is a positive feedback between tropical Pacific surface wind and ocean temperature, which essentially means processes in the ocean and atmosphere goad each other to bring on an ENSO event. As I write, we’re in a La Niña, so I’ll outline the feedback starting there.
During La Niña
We often don’t know exactly what initiates the feedback loop—sometimes sea surface temperatures start to cool and then the trade winds begin to strengthen, or vice versa (3). But, we have to start somewhere, so I’ll start with the ocean cooling (4). This means the difference (or gradient) in temperature between the relatively warmer western Pacific and the cooler eastern Pacific becomes even larger than normal. Over the western Pacific, warmer temperatures cause air near the surface to rise, moisten, and become convective, leading to thunderstorms and more rain (just like how warm air rises into an attic, though thankfully, thunderstorms won’t form in a house). Over the cooler eastern Pacific, air begins to sink more and dry out (also why basements are colder). With the increases in sinking motion over the eastern Pacific and rising motion over the western Pacific, the trade winds that typically blow from east-to-west along the equator become even stronger.
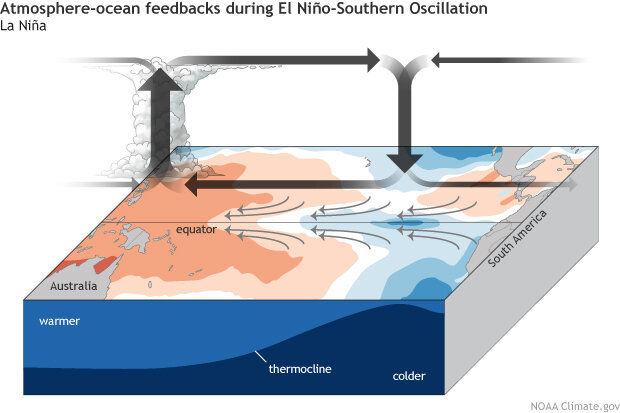
During La Niña, the surface trade winds (small gray arrows) blow more strongly than normal, piling up warm surface water in the western Pacific and drawing up deep, cool water in the eastern Pacific. Over the warm waters, the air becomes more buoyant (upward thick arrow), and rainfall increases. Over the cool waters, it is less buoyant, favoring subsidence (downward gray arrow) and less rainfall. These feedbacks between ocean and atmosphere strengthen the La Niña event. Climate.gov schematic by Emily Eng and inspired by NOAA PMEL.
These stronger-than-normal winds, in turn (here’s the feedback!), then help to reinforce the ocean temperature anomalies by increasingly pushing water away from the eastern Pacific to the western Pacific Ocean. This allows deeper colder water, which is residing below the surface of the surface water, to upwell and cool the surface even more. These same winds help to transport surface water, heated by the sun along the way, to the western Pacific, which literally piles up warmer water around Indonesia (sea level height also increases). What do these warmer waters do? They help the air to rise even more over Indonesia (leading to increased convection/rainfall in the region) and, over the central and eastern Pacific Ocean, the colder surface waters result in diminished convection/rainfall (5). In summary, the initial stronger-than-normal trade winds and east-west contrast in surface temperatures become even stronger because of this positive Bjerknes feedback.
During El Niño
The feedback begins when the trade winds weaken and/or the sea surface temperatures warm in the parts of the central and eastern Pacific Ocean. Starting with changes in the ocean, this means that the normally cool eastern Pacific becomes warmer, leading to increased rising motion over the central and/or eastern Pacific and more convection and rainfall. Over Indonesia and the far western Pacific, the waters cool slightly, resulting in more sinking motion (less rainfall and convection). Meanwhile, the trade winds (that typically blow along the equator from the east-to-west) weaken because they normally blow from areas of sinking motion to areas of rising motion--now those areas are reduced relative to the normal state.
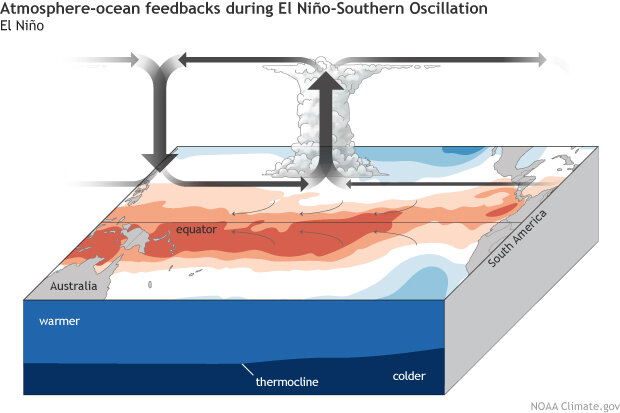
El Niño feedbacks between the ocean and atmosphere. During El Niño, the eastward expansion of the convection and rainfall will depend on how warm the absolute sea surface temperatures becomes in the eastern Pacific. This means that during weaker El Niño events, we may only see convection and rainfall increase around the Date Line. But during stronger El Niño events, the increase in convection and rainfall can potentially extend from the Date Line all the way to coastal Ecuador/Peru in South America. Climate.gov schematic by Emily Eng and inspired by NOAA PMEL.
These weaker surface winds (feedback time!) then, in turn, result in the reduction of the cold-water upwelling from the deep ocean in the eastern Pacific Ocean. Because the upwelling reduces and there is less transport from the eastern to western Pacific, the temperatures increase in the east. Now the winds are acting to reinforce the initial oceanic warming! Also, because of the slowdown in the transport of water to the western Pacific Ocean, the sea surface temperatures and sea level height sometimes decrease in the west (though maybe less so in recent years).
Fresh out of the oven
So this is how changes in the ocean temperature push along the atmospheric variations in winds/pressure/rainfall, and, vice versa, the atmospheric changes help to reinforce the ocean temperatures. However, El Niño and La Niña events don't last forever—these events sow the seeds of their own destruction, through delayed processes in the ocean that I’ve described before.
The Bjerknes feedback also explains why there are so many different ways to measure ENSO. There are dozens of time series, or indexes, of various types (composed of temperature, pressure, rainfall, winds, etc.) that are strongly related, or as we say, correlated (a perfect correlation has a value of 1). For instance, the Southern Oscillation index (based on sea level pressure differences) has a correlation of ~0.9 with the Niño-3.4 index (measures sea surface temperatures in the east-central equatorial Pacific Ocean). The strong links between different types of meteorological variables is evidence that ENSO is one very large and interconnected system!
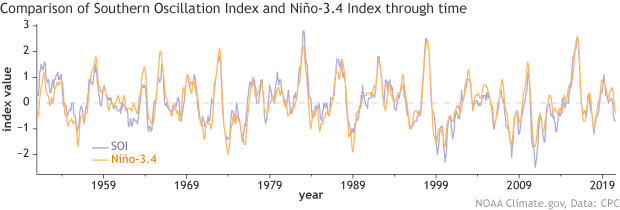
Time series (or indexes) of running, seasonal averaged Equatorial Southern Oscillation (SOI) and Niño-3.4 sea surface temperature (using ERSSTv5 data) during 1950- 2020. Climate.gov image based on NOAA CPC data.
So next time you smell fresh baked bread, think of Jacob Bjerknes, who wrote the recipe, assembling the ingredients of the ocean and atmosphere that give rise to the marvelous climate phenomenon we now call the El Niño-Southern Oscillation or ENSO.
References
Adamson, G., 2020, IMPERIAL OSCILLATIONS: Gilbert Walker and the Construction of the Southern Oscillation, Weather, Climate, and the Geographical Imagination: Placing Atmospheric Knowledges. Mahony, M. & Randalls, S. (eds.). University of Pittsburgh Press, p. 43-66, https://doi.org/10.2307/j.ctv10h9g13.6
Adamson, G., 2019, El Niño and Society. Oxford Research Encyclopedia of Climate Science. Oxford University Press. https://doi.org/10.1093/acrefore/9780190228620.013.720
Bjerknes, J. (1969). Atmospheric teleconnections from the equatorial Pacific. Monthly Weather Review, 97(3), 163–172.
Carrillo, C. (1892). Hidrografía oceánica. Bol. Soc. Geogr. Lima, 1, 72–111.
Walker, G. T. (1924). Correlation of seasonal variations in weather IX. A further study of world weather. Mem. Indian Meteorol. Dep., 24, 275–332.
Footnotes
(1) In his interesting chapter, “El Niño and Society,” George Adamson (King’s College London) notes the long delay was partially due to the decrease in research during World War II and also low variability in the Southern Oscillation during the mid-20th century. He goes on to add that the Cold War was conducive to El Niño research in two ways: (1) To foster collaboration following the death of Joseph Stalin, a global research program called the International Geophysical Year (IGY) of 1957-58 was funded. (2) The “Alliance for Progress” program in 1960 led to several research cruises to the eastern Pacific Ocean.
(2) Peruvian fishermen first recognized the warming of the eastern Pacific Ocean and called it “El Niño,” perhaps going back centuries (Carrillo, 1892). “El Niño” was used to describe a warm water current that emerged off Peru and Ecuador during December/January. This term, however, was first applied to describe typical seasonal variability and not more exceptional swings that are more commonly used to describe today’s ENSO events (Adamson, 2019).
(3) A friend reading over this blog article immediately stopped me here and said, “Wait, why is the ocean, all of the sudden, starting to cool?” Equivalently you can ask, “Why do the winds start blowing stronger?” And the answer is, we often don’t know why the tropical Pacific Ocean begins pushing in a certain direction. There are times we have a hunch that something it happening based on ocean dynamics (such as the discharge of waters during the peak of El Niño that help transition to a La Niña). We also know about the many different patterns that can precede ENSO events that Emily has previously detailed here and from Dan Vimont’s article on the Pacific Meridional Mode and from Jason Furtado’s article on the South Pacific Oscillation. But the fact is when you’re monitoring these events in “real time” (from day to day) it is sometimes quite difficult to identify a clear cause that kicks off subsequent coupling. Also, you can’t rule out just random, unforeseeable changes!
(4) I’m starting with the ocean in this example, but you can equivalently start the process with stronger trade winds. Stronger trade winds push the water away from the eastern Pacific Ocean, which then allows deeper colder water, which is residing below the surface of the warmer surface water, to upwell and emerge at the surface. Thus, a pattern emerges with below-average surface temperatures in the eastern Pacific and above-average surface temperatures in the western Pacific. This stronger gradient can then, in tern, help to reinforce the trade winds following the logic provided above.
(5) Though notably, it’s hard to have below-average rainfall over a region that typically gets little to no rain to begin with, which is why we often see larger departures from normal (anomalies) in the central Pacific.
Comments
The Rise of El Niño and La Niña
ENSO dynamics
ITCZ
RE: ITCZ
The precipitation anomalies over the tropical oceans during each phase of ENSO reflect the impacts of ENSO on the ITCZ. Generally, the precipitation patterns during El Nino reflect a southward shift of the ITCZ in the western Pacific, whereas La Nina causes a northward shift. We see the most dramatic changes during extreme El Nino events, when the ITCZ swings south to the equator.
Geo-thermal weather impact
Confusion
wow this blog is very cool…
wow this blog is very cool and can add to my knowledge
El Niño and La Niña
How is it possible for atmospheric CO2 to affect the trade winds strength and the alternating cold phase La Niña and the warm phase El Niño? There doesn't seem to be any correlation.
Just thought to drop a line hi
Comments have been disabled on this article