
According to NOAA’s Regional Snowfall Index, the January 22–24, 2016, snowstorm ranked as a Category 5 —“crippling”—event for both the Northeast and Southeast.
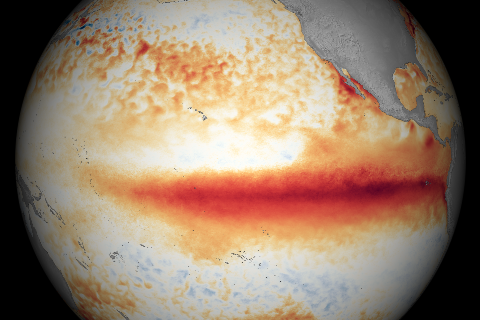
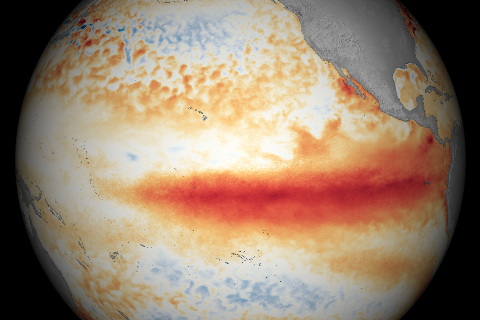
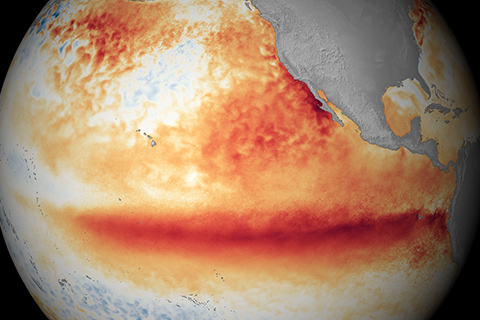
A strong El Niño continued during December 2015 with well above average sea surface temperatures across the central and eastern equatorial Pacific Ocean, according to NOAA Climate Prediction Center’s monthly El Niño advisory update.
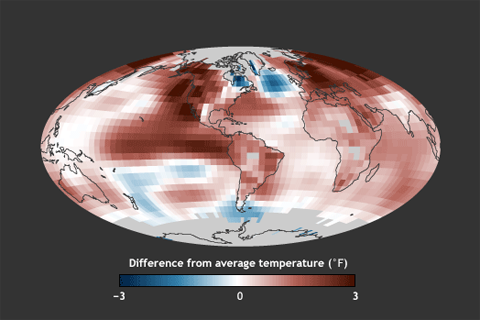
Global surface temperature was record warm in 2015, moving ahead of the record set just last year by 0.29°F—the largest margin by which one year has ever beaten another since official records began in 1880.
Answers to some of the questions that readers frequently ask NOAA experts about El Niño and La Niña.
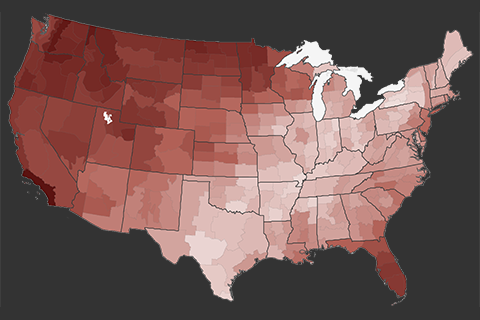
The 2015 annual average U.S. temperature was 54.4°F, 2.4°F above the 20th century average, the second warmest year on record.
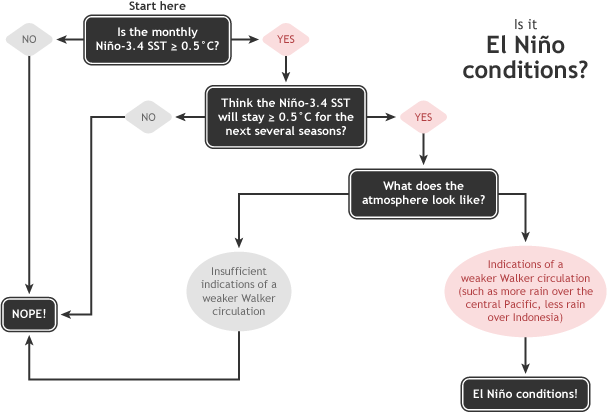
NOAA's Climate Prediction Center monitors and issues outlooks for El Niño and La Niña using a 2-category (watch/advisory) alert system.

Walruses use sea ice for mating, giving birth, and resting, which means they face an increasing threat from global warming.
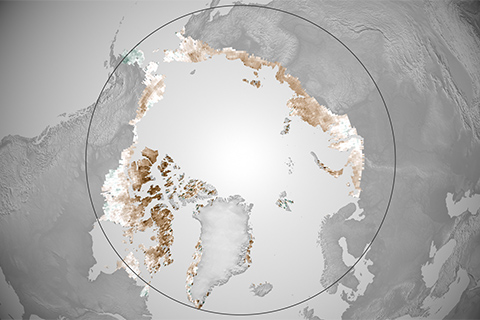
As the Arctic has warmed over the past three decades, satellites reveal it has also grown greener overall. But in recent years, the tundra appears to be “browning down.”
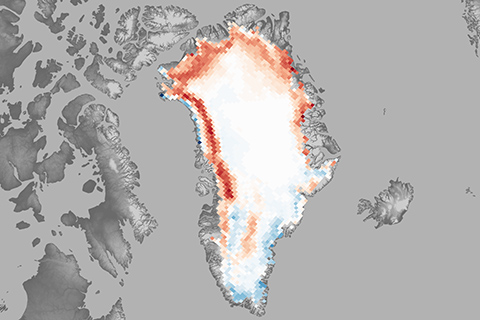
The melt season was up to 30 to 40 days longer than average in western, northwestern, and northeastern Greenland, but was close to or below average elsewhere on the ice sheet. Melt area was above average on 52 of the 90 days of the melt season.