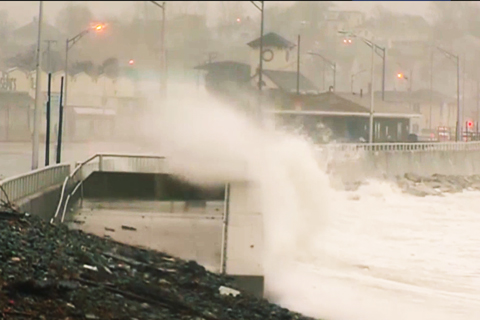
Developed by the NOAA Coastal Services Center, the sea level rise viewer offers access to data and information about the risks of sea level rise, storm surge, and flooding along the coastal United States. The Web-based map has the potential to help people build (or rebuild) in a more resilient way.
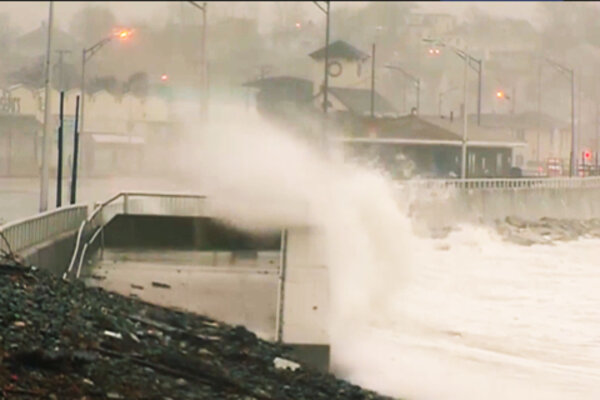
Explaining the NOAA Sea Level Rise Viewer
October 29, 2013
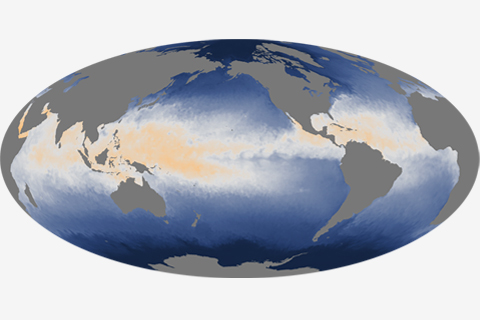
While heat is stored and mixed throughout the depth of the ocean, it is the temperature at the surface—where the ocean is in direct contact with the atmosphere—that plays a significant role in weather and short-term climate.

Ron Stouffer and Gabriel Vecchi of NOAA’s Geophysical Fluid Dynamics Laboratory in Princeton, N.J., share their experiences working on one of the most comprehensive scientific documents in history.
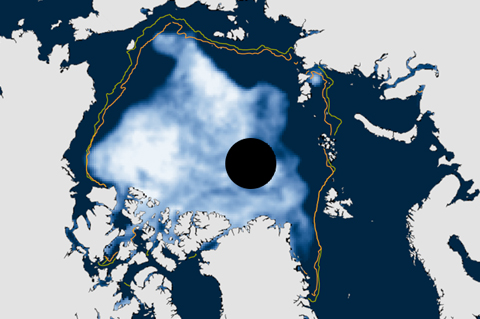
To be consistent with NOAA's use of 30-year periods for the official "climate normals," the National Snow and Ice Data Center switched its baseline period for sea ice analyses from 1979-2000 to 1981-2010. Compared to the new normal, the low ice conditions of the recent past will appear less abnormal than they used to.
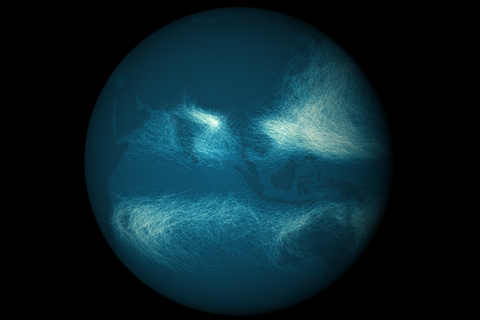
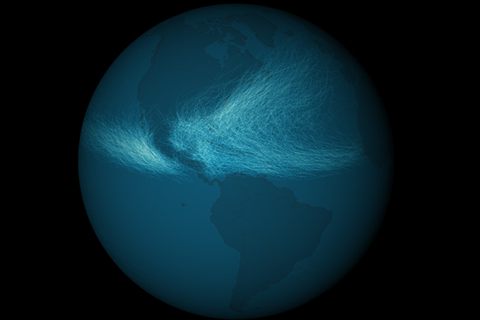
Maps of the thousands of storms that have passed through the Eastern Hemisphere tropical oceans in the past century or so reveal a more crowded landscape than similar maps of the Western Hemisphere. Unlike the Western Hemisphere, where storms are mostly confined to areas north of the equator, the Eastern Hemisphere sees storms in both north and south tropical waters.

