Climate & the crowds at national parks
In 2014, America's national parks hosted a record-breaking 292.8 million visits, breaking the previous record of 287.1 million visits set in 1999. According to a recent study, warming temperatures will attract even more visitors to most national parks in coming decades. The change could both increase economic opportunities and put stress on park staff, facilities, and natural and cultural resources.
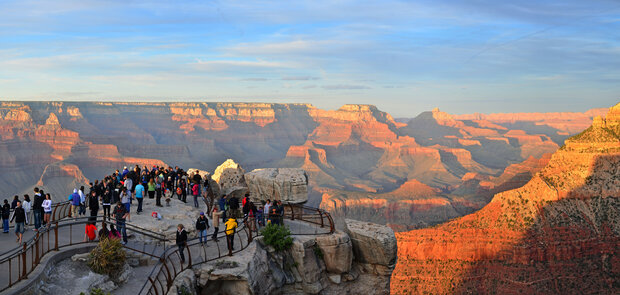
Visitors look out on the Grand Canyon at Mathers Point. Image courtesy U.S. National Park Service, via Flickr.
Researchers considered the relationship between historical long-term temperature averages and park visitation numbers, identified parks where visits were influenced by temperature, and used these data and projected greenhouse gas concentrations* to estimate future park visitation. Overall, warming temperatures are projected to increase total annual visits to most parks. Some parks in the lower latitudes are projected to welcome fewer visitors in the future, but no less than 80 percent of the historical average.
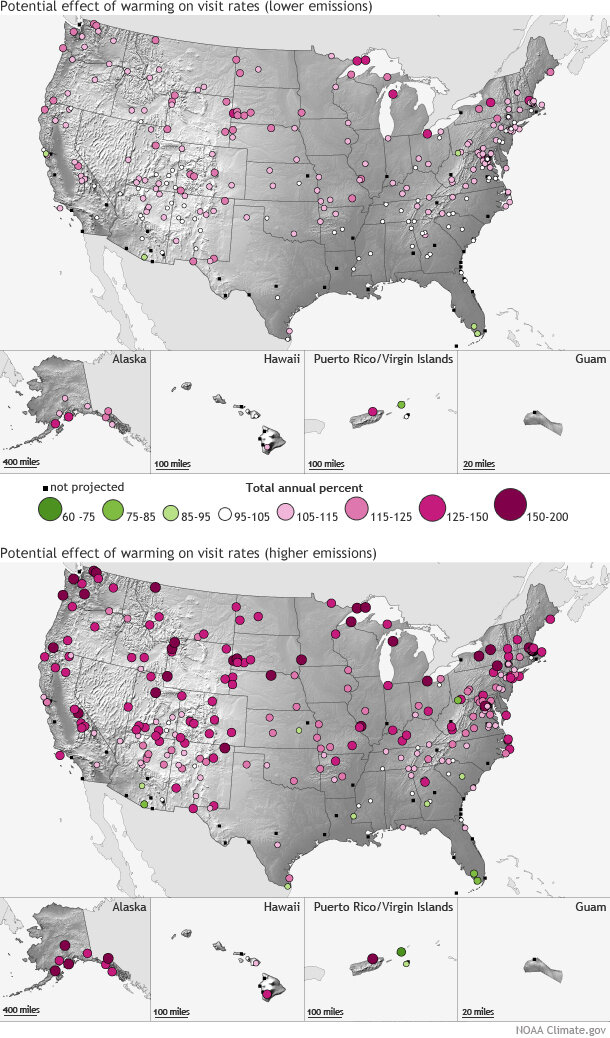
Annual visitation by mid-century (2041–2060) as a percentage of historical values (1979–2013), based on a medium-low greenhouse gas emissions scenario (top) and a higher-emissions scenario (bottom). Black squares are parks where visits were not connected to temperature. NOAA Climate.gov map based on data from Fisichelli et al.
Warmer temperatures are expected to increase visitation during all seasons, with park visits projected to increase 5–19 percent during the peak season. An even higher increase of 9-24 percent is expected during the shoulder season (two months prior to and after the peak season), and an increase of 13–31 percent is projected during the low season (quietest three months). At most parks, the overall length of the visitation season expands by an average of 13-31 days.
A small number of parks were projected to experience very warm months, resulting in rapid drop-off in visit numbers.
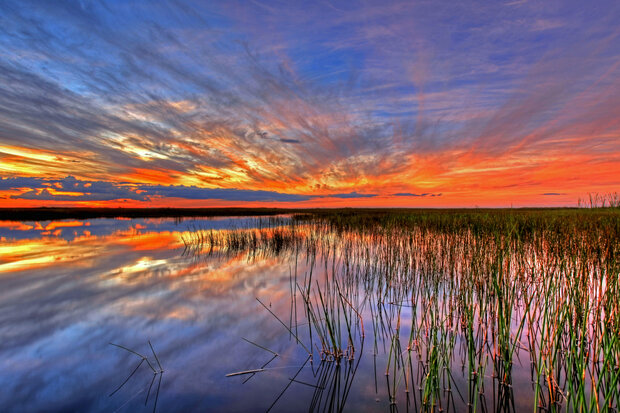
A stained glass sky over the Everglades in October 2009. The Everglades is one of a handful of parks where excessive heat is projected to suppress annual visitation by mid-century. Photo courtesy U.S. National Park Service, via a CC license.
Planning for change
While people take a lot of factors into consideration when they plan trips to national parks, such as school holiday schedules, the study finds that based on their visitation patterns, tourists do take long-term climate averages into careful consideration. The strong link between visitation and climate can help park managers and businesses anticipate and plan for changing demands in the types and timing of services, not just within the parks but in the local communities that host tourists.
While larger numbers of visitors may bring potential economic benefits and increased opportunities in the off-season, many national parks already face challenges with congested parks during peak season. Larger numbers of visitors during previously low-staffed periods could also place new demands on park operations and facilities.
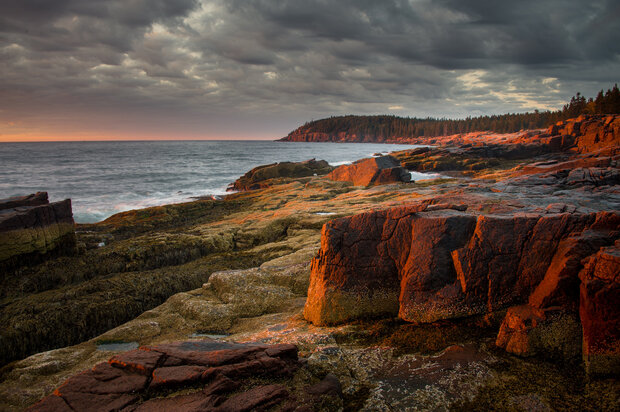
Golden light bathes the shoreline at Thunder Hole in Acadia National Park, Maine, shortly after sunrise on an October morning. Historically, peak visitation at Acadia Nationak Park occurs in August. Warming is projected to increase visits during the parks current "shoulder" season months of early summer and early fall. Photo by Flickr user Dave Wilson, via a CC license.
Climate change impacts including sea level rise, severe weather events, and shifts in the timing of fall foliage, river flows, snow melt, and other natural cycles all have potential to influence visitors’ decisions on the best time to visit. In addition, the iconic glaciers, beaches, birds, insects, mammals, and vegetation that millions of people travel to see are already responding to the impacts of ongoing climate change.
*The projections shown in the top map are based on a medium-low emissions scenario that climate modelers refer to as RCP 4.5, which assumes that annual greenhouse gas emissions peak around 2040 and then decline through 2100, presumably from climate policies that limit emissions. The bottom map is based on a higher emissions scenario called RCP 8.5, which assumes continued increases in carbon dioxide emissions.
Reference
Fisichelli NA, Schuurman GW, Monahan WB, Ziesler PS (2015) Protected Area Tourism in a Changing Climate: Will Visitation at US National Parks Warm Up or Overheat? PLoS ONE 10(6): e0128226.
Links
CNN: National parks saw record numbers of visitors in 2014. Updated: February 17, 2015.
U.S. National Park Service: Climate Change and Your National Parks.
