Extreme Rainfall Analyses Can Point to Right Size for Culverts
Considering culverts
Laura Sager is the Executive Director of the Soil and Water Conservation District in Columbia County, New York. Among a range of important topics that occupy her days, Sager spends an increasing amount of time on a topic that many people consider mundane: she’s thinking about culverts.
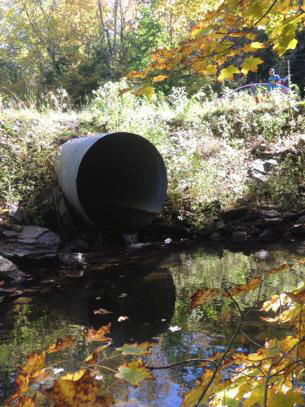
Culvert on Lake Creek in Rensselaerville, NY. Photo courtesy Wikimedia Commons.
Culverts—simple tubes or tunnels that channel water beneath roads, railroads, and trails—are a hallmark of the developed world. Wherever humans can engineer relatively small amounts of water to flow through a tube beneath a roadway, the road is smoother and travel speeds along it are higher. Culverts serve as miniature bridges, keeping roadways high and dry, just above flowing water that could erode them away.
Heavy precipitation
The reason culverts are commanding Sager’s attention is rain. Across the contiguous United States, and especially in the Northeast, the amount of precipitation falling in very heavy events has increased significantly over the last century. During heavy rains, huge volumes of water fill drainage systems quickly, and can overwhelm installed culverts.
When a culvert cannot convey the amount of water attempting to flow through it, water typically backs up on the upstream side, causing localized flooding. The accumulated water may overflow across the roadway, disrupting transportation and increasing erosion that can wash out the culvert. Sediment and debris from an upstream failure may cause additional failures downstream, flooding other roads, houses, and cropland. Even small-scale flooding at undersized culverts can degrade water quality, erode stream banks, block access to habitat for aquatic organisms, and damage private and municipal property.
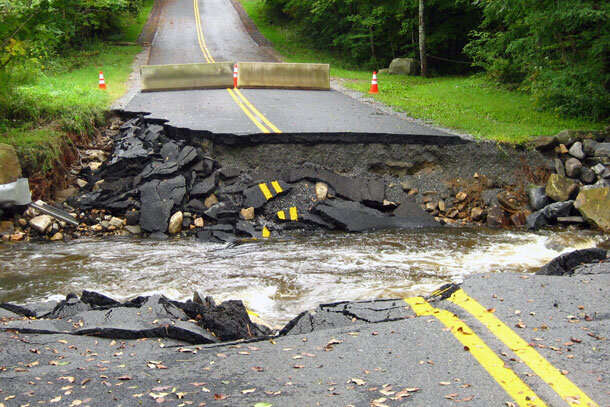
Culvert washout at Walker Brook in Becket, Massachusetts. Photo courtesy Massachusetts Division of Ecological Restoration.
To avoid these issues and keep drainage systems functioning, Sager needs to identify the culverts in her district that are too small for the volume of water that may come their way. With hundreds of culverts of varying size and purpose across the county, she also needs data that can help her identify the most important culverts for replacement.
A wealth of historical climate data
Climate records are a key resource engineers use to select appropriate diameters for culverts in various locations. Culverts shouldn’t be too small, as the frequent flooding that would result leads to societal disruptions and environmental damage. Culverts shouldn’t be too large either, as their cost would inflate the price to complete projects.

Culvert washout in Liberty, NY. Photo courtesy Wikimedia Commons.
Statistical analyses of extreme rainfall data from the Global Historical Climatology Network-Daily database can be helpful for calculating appropriate diameters for culverts. These analyses, available through NOAA Atlas 14, provide estimates for the recurrence interval of extreme rainfall amounts. For instance, the Atlas reports that in Rhinebeck, NY, an 8-inch rainstorm can be expected to occur once every 100 years, while storms that produce at least 7 inches of rain are twice as likely. With this information, Sager can assess the climatological risk of particular culverts failing in any given year, and weigh the economic, societal, and environmental costs against the benefits of installing new culverts.
But what about the future?
Unfortunately, the observed increase in frequency of extreme precipitation events shows that the past is no longer an adequate guide for the future. Culverts that were of an adequate size when they were installed decades ago are now prone to flooding and failure. Sager faces a dilemma: should she rely on the historical data which may not reflect conditions 10, 20, or 50 years into the future, or should she install larger culverts—oversized by current standards—that will be adequate to accommodate future rainfall extremes?
Updated data and new tools
Work conducted by NOAA’s Northeast Regional Climate Center at Cornell University, with funding through NOAA’s Sectoral Applications Research Program, is providing Sager and her colleagues with several additional resources to help solve this quandary. Annually updated extreme rainfall analyses collected as part of the Extreme Precipitation in a Changing Climate project provide a perspective as to how quickly values describing a 100-year storm are changing.
Similarly, global climate model projections for future extreme rainfall also provide indications of how the current trend may continue in the future. Finally, online tools based on hydrological models that account for land use and topography can inform users about the volume of runoff expected under different conditions.
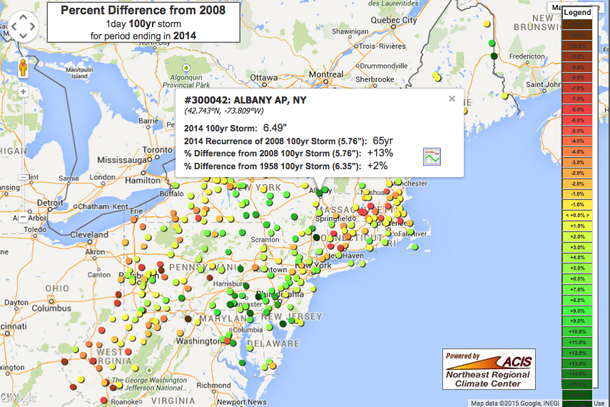
Screen shot of the map interface of the Extreme Precipitation in a Changing Climate project. Green dots show increases in the frequency and magnitude of a 100-year,1-day rainfall extreme (a 1-day rainfall total so large that it occurs on average only once every 100 years). At a station in Albany, NY, a 1-day rainfall event that in 2008 would have occurred only once in a hundred years on average now has an average recurrence interval of 65 years.
These tools allow Sager to develop her own scenarios for the future, incorporating changes in basin characteristics such as increased development or enhanced retention, to help her select appropriately sized culverts for various locations. Engaging with stakeholders and evaluating a range of culverts is also helping Sager identify which culverts are the most critical to replace. One culvert at a time, Sager is helping build Columbia County’s climate resilience, and her success is convincing municipal partners and funding agencies to join the effort.
Links and Resources
Precipitation Frequency Data Server (PFDS)
Extreme Precipitation in a Changing Climate Project
Partners
Columbia County Soil and Water Conservation District
Cornell University | Northeast Regional Climate Center
New York State Department of Environmental Conservation | Hudson River Estuary Program
Datasets Used
Global Historical Climatology Network (GHCN) Daily
Originally published on the U.S. Climate Resilience Toolkit website.