Increasing corn crop value

On August 25, 2011, Dr. Elwynn Taylor, Iowa State University’s Extension Climatologist, tweeted to Iowa corn farmers: “Weather based statistics indicate a US corn yield of 149BPA, the prime factor this year is the Aridity Index.” Taylor uses NOAA climate information and seasonal outlooks to help thousands of the region’s farmers manage risk. Nearly 5,000 followers look to his Twitter feed for guidance.
According to Taylor, who learned how to read satellite data in the military and still sports a crew cut, farmers want to know three things: how their crop is going to turn out, what it’s going to be worth, and when is the right time to sell. NOAA data figures into all of these decisions.
Farmers’ interest in NOAA’s climate forecasts begins in the winter, around late February. By March 15, each farmer must decide how much crop insurance to buy for the year. If they don’t make a proactive decision, they will buy the same level of insurance that they did the previous year. The best guide they have, says Taylor, is NOAA’s long-term forecast. In El Niño years there is a 70 percent chance that corn yields in Iowa will be above the trend line. (The term “trend line” refers to the 30-year moving average yield per acre, which has risen a bit each year with improved crop management and plant genetics).
Farmers’ insurance decisions based on NOAA’s El Niño forecast are an important part of their year’s financial risk management. As Taylor points out, “That is information a farmer can take to the bank.” Taylor spends the weeks leading up to March 15 speaking about the forecast twice a day, every day, to groups of about 200 Iowa farmers. 2011 was a La Niña year, so Farmers attending Taylor’s lectures learned that there was a 70 percent chance of corn yield dropping below the trend line.
By summer, the year’s crop insurance decisions were long since made, and farmers’ interest in NOAA forecasts shifted to corn prices and selling decisions. The season had brought floods to the Missouri River starting in May, and they had not let up.
In late July 2011, as flooding persisted and a brutal heat wave gripped much of the United States, corn farmers in the Missouri and Red River valleys turned to Taylor and his data for answers. Could they sell their crop on the futures market with confidence, or should they hold off in case disastrous weather left them no crop to sell? What was the chance that corn prices would skyrocket at the local ethanol plant downstate, where the crop reporting district maps showed the flood impacts were worst? Would they be able to profit from the plant’s predicament? All these decisions were informed by data from NOAA.
Taylor posted maps on his Twitter feed and web page showing the Aridity Index, which combines NOAA’s temperature and precipitation data. Heat and moisture both play key roles in corn growth. As a rule of thumb, Taylor says, one standard deviation in moisture has the same effect on a crop as one standard deviation in temperature. Farmers could look at the Aridity Index maps and calculate the probability of risks to their own crops as well as see how neighboring crop districts were faring.
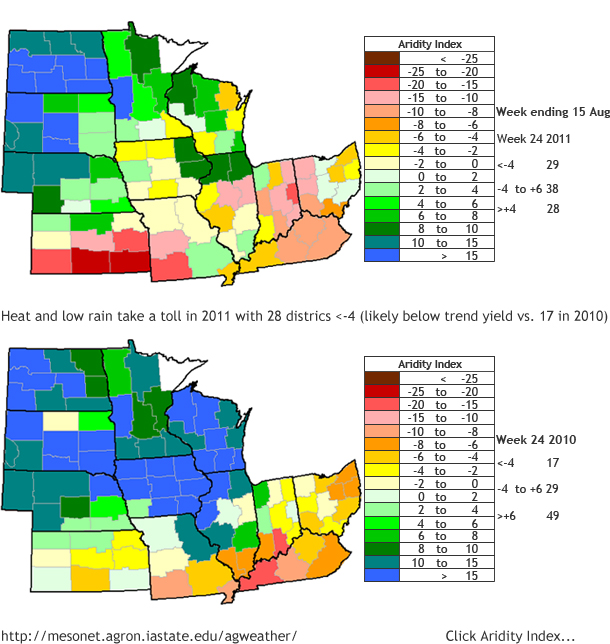
Most farmers want to know if their farm’s misfortunes are the same as their neighbors’. If the national crop yield is looking weak, farmers can hold out and expect that prices will go up. Poor conditions confined to a small region can be bad news for farmers. But as more ethanol plants are built in Iowa, looking to buy local grain to avoid shipping costs, local markets are becoming more important. Knowing how neighboring counties are faring is increasingly relevant to farmers and grain buyers setting the selling price for Iowa’s corn.
To explain the Aridity Index, Taylor posted a quote on his website from a northwest Iowa farmer: “It has been hot, but at least the soil moisture is good,” the farmer said.
Corn is particularly sensitive to heat and moisture during crucial stages of its development, such as the pollination period, when long silks emerge from the ears and the kernels get ready to fatten up. Corn is better able to tolerate heat if the soil is moist. Dry soil can lower the rate at which corn turns sunlight into energy, which can lead to smaller corn harvests if water deficits continue.
In July 2011, despite widespread triple-digit temperatures, NOAA’s climate data indicated that soil moisture was higher than normal in many corn-growing regions. This information helped reassure farmers that this particular heat wave would not be as harmful as it could have been. Because of corn’s ability to tolerate heat if there is moisture in the soil, area farmers could expect that the yield would be fairly robust in spite of the intense heat.
Because of the flooding earlier in the season, they could also hope to get good prices for their corn. In fact, the director of research for the Iowa Farm Bureau was quoted on Farmprogress.com as saying that wet weather in the Dakotas and Ohio, plus new flooding in the Mississippi River basin, had caused an estimated loss of 2 million harvestable acres in the last month. “That is likely to frenzy the corn market and we may see the highest prices yet for corn,” the director said.
As it turned out, Iowa farmers made an average of $684 per acre on their corn that August, 87 percent higher than the year before.
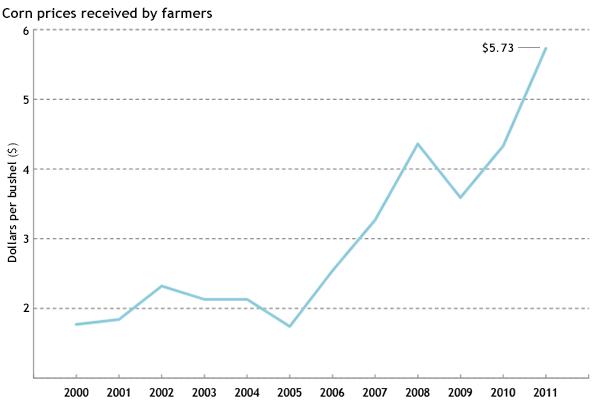
The U.S. corn crop is worth $66 billion, so even a small drop in production or shift in prices can have a big impact on state and local economies. That is why farmers, agricultural extension agents, businesses, commodities traders, and agencies such as the U.S. Department of Agriculture have long looked to NOAA’s weather and climate information to inform their planning, management, and financial decisions.