Could climate change make Atlantic hurricanes worse?
Atlantic hurricane activity has increased since the 1970s, but the relatively short length of high-quality hurricane records does not yet allow us to say how much of that increase is natural and how much may be due to human activity. With future warming, hurricane rainfall rates are likely to increase, as will the number of very intense hurricanes, according to both theory and numerical models. However, models disagree about whether the total number of Atlantic hurricanes will increase or decrease. Rising sea level will increase the threat of storm surge.
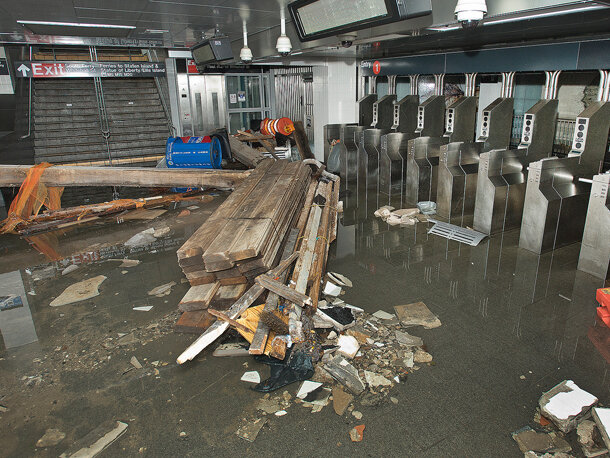
New York's South Ferry subway station after it was flooded by seawater during Sandy. Photo courtesy of the Metropolitan Transportation Authority, Patrick Cashin.
Hurricane activity is undeniably linked to sea surface temperatures (see Ch. 2: Climate, Box 2.5 for a discussion on the 2017 Atlantic hurricane season). Other influences being equal, warmer waters yield stronger hurricanes with heavier rainfall. The tropical Atlantic Ocean has warmed over the past century, at least partly due to human-caused emissions of greenhouse gases. However, high-quality records of Atlantic hurricanes are too short to reliably separate any long- term trends in hurricane frequency, intensity, storm surge, or rainfall rates from natural variability. This does not mean that no trends exist, only that the data record is not long enough to determine the cause.
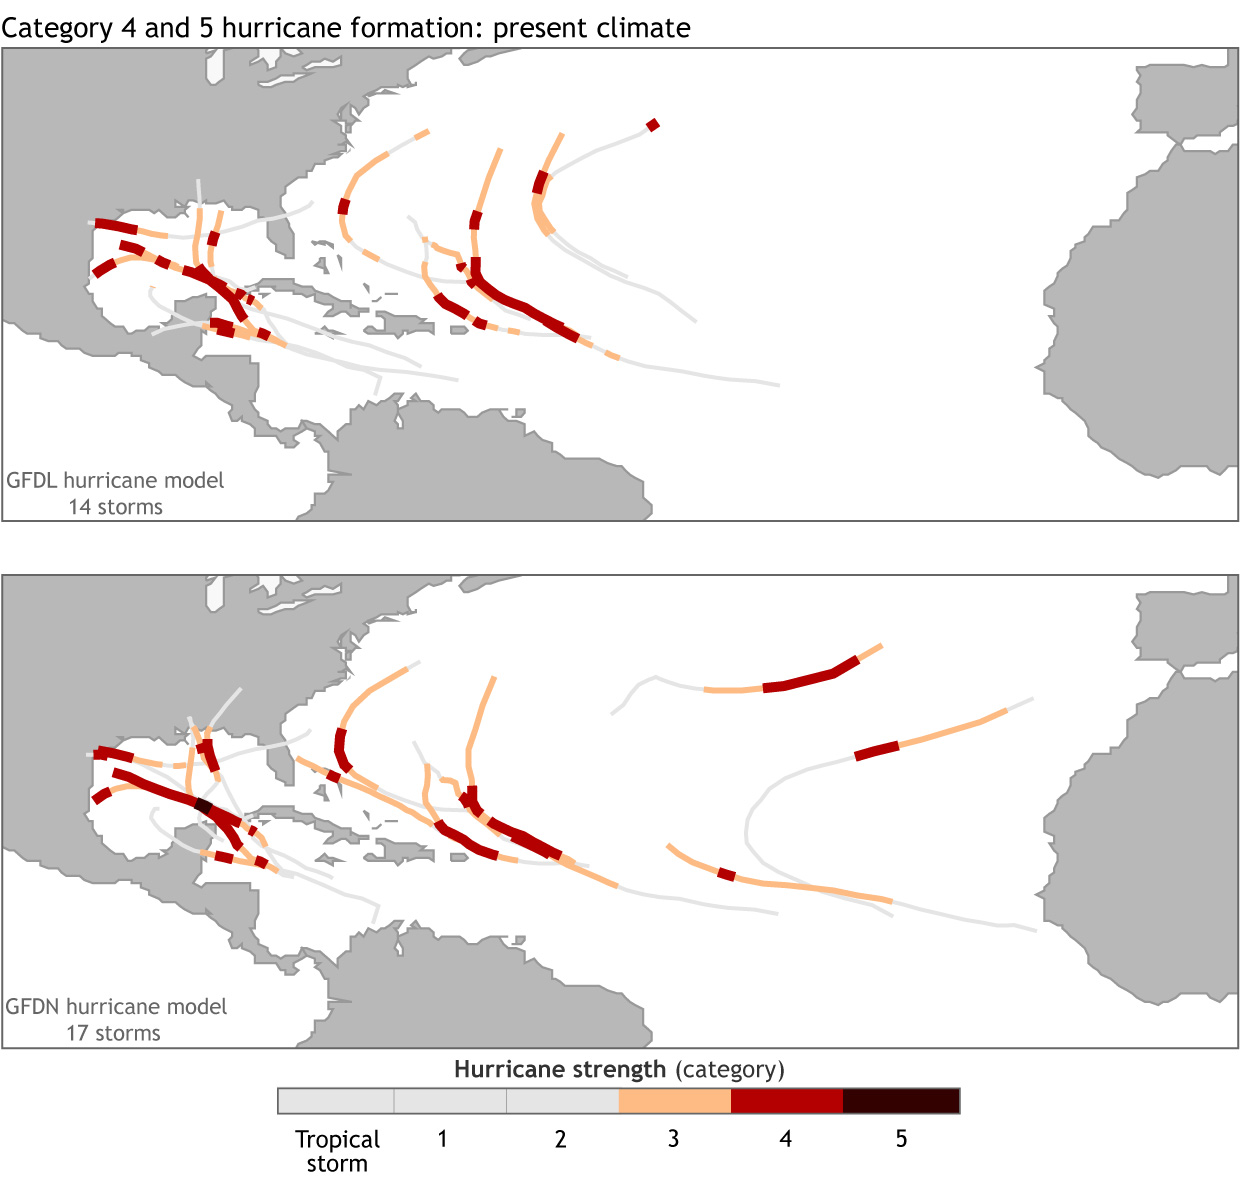
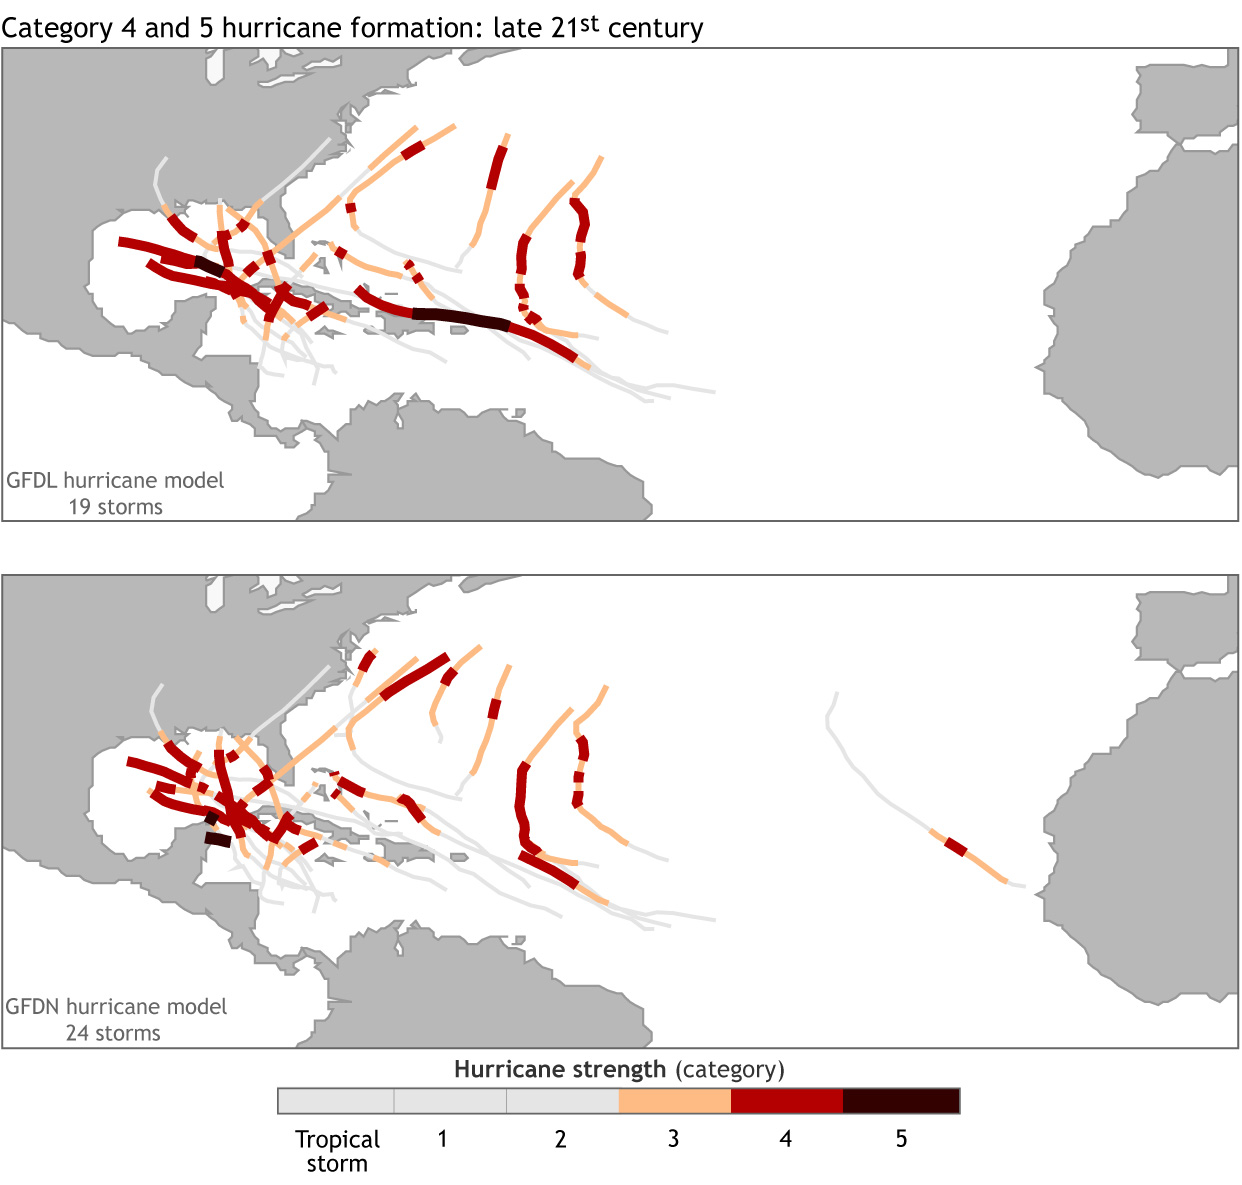
Most models agree that climate change through the 21st century is likely to increase the average intensity and rainfall rates of hurricanes in the Atlantic and other basins. Models are less certain about whether the average number of storms per season will increase or decrease. Early modeling raised the possibility of a significant future increase in the number of Category 4 and 5 storms in the Atlantic (below). While that remains possible, the most recent high-resolution modeling provides mixed messages: Some models project increases in the number of the basin’s strongest storms, and others project decreases.
These maps show computer-simulated tracks and intensities of hurricanes in a typical season under the present climate and in the future if we follow a path of lower greenhouse gas emissions (RCP4.5). Portions of storm tracks with wind speeds classified as Tropical Storm or Category 1 or 2 are light gray. Periods of Category 3, 4, or 5 intensity are colored orange, red, or black, respectively. The first frame of the animated gif shows tracks from two different models under current climate conditions (1980–2006). The second frame shows projections from the same models for late-21st century (2081–2100) conditions. These projections show an increase in the frequency of Category 4 and 5 hurricanes, with a higher tendency of these storms to shift towards the Gulf of Mexico, Florida, and the Caribbean (as opposed to remaining in the open Atlantic Ocean). Adapted by Climate.gov from the Fourth National Climate Assessment (Figure A5.21), based on figures provided by Tom Knutson. Static images: present | future
Regardless of any human-influenced changes in storm frequency or intensity, rising sea level will increase the threat of storm surge flooding during hurricanes (Ch. 8: Coastal; Ch. 18: Northeast; Ch. 19: Southeast; Ch. 20: U.S. Caribbean; Ch. 23: S. Great Plains).
This article was originally published in the FAQs accompanying the Fourth National Climate Assessment. The text has not been modified, but we have added the photo of flooding from Sandy and made some stylistic changes to the hurricane tracks figure.