NOAA satellites go HD with GOES-R
Last week, NOAA engineers and satellite mission scientists had something extra to be thankful for: the successful launch of GOES-R on November 19. Providing more timely and accurate information over the Western hemisphere, total lightning mapping, and higher resolution images streaming down from space more often, the new mission marks the first major redesign of the nation’s operational Earth-observing technology in more than 20 years.
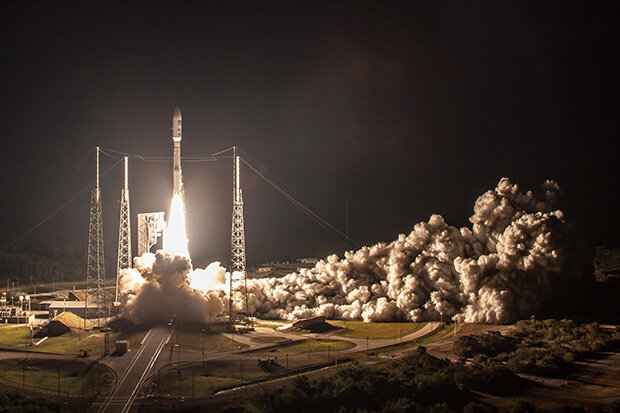
A United Launch Alliance Atlas V 541 lifts off with NASA's GOES-R satellite. GOES-R is the first of four satellites to be launched for NOAA in a new and advanced series of spacecraft. Once in geostationary orbit, it will be known as GOES-16. Taken on November 19, 2016. Credit: United Launch Alliance.
A Rich History
NOAA’s Geostationary Operational Environmental Satellites (GOES) have served as the foundation of the nation’s near real-time weather and environmental monitoring system since the launch of GOES-1 in 1975. GOES-1 only viewed the Earth every 30 minutes. Our current GOES East and GOES West satellites were launched in 2006 and 2010 respectively, and while they’ve come a long way from the technology of the 70s, all you have to do is think of how much your cell phone has changed since 2006 and you can understand why our weather satellites were due for an upgrade. (Hint: The first generation iPhone came out in 2007).
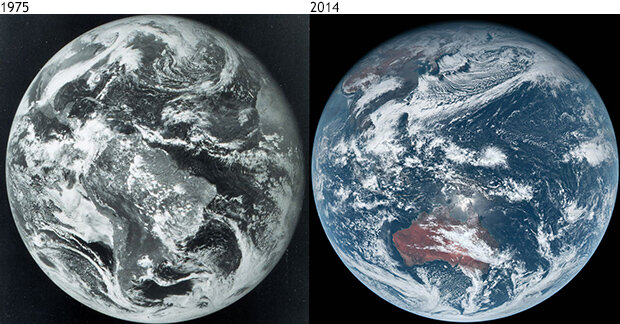
On the left is the first image obtained from the GOES-1 satellite. October 25, 1975. On the right is an image from Japan’s Himawari-8 satellite, whose advanced imager is similar to GOES-R's. Images from NOAA Photo Library via Wikimedia Commons, and NOAA/JMA via www.jma.go.jp.
“We’ve been flying operational geostationary satellites for 41 years now, and for the last 22 years we’ve been flying the same basic instrument design,” said Steve Goodman, senior scientist for the GOES-R program. “This is the first major upgrade in 22 years.”
GOES-R launched with six key instruments, with two pointing towards the Earth, two focused on the surrounding space environment, and two more keeping an eye on the sun. For monitoring Earth’s weather climate research, it’s the two pointing towards Earth that are the most exciting.
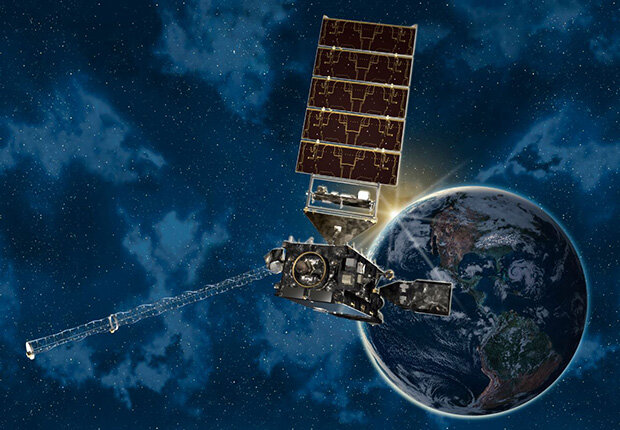
An artist's rendering of GOES-R in space. Credit: Lockheed Martin.
More than your average camera
The Advanced Baseline Imager (ABI) will be the go-to instrument for imaging Earth’s weather, land, oceans, and climate. It’s called an imager, rather than just a “camera,” because it captures way more than the visible wavelengths of light that are captured by a camera for a regular photograph.
The new imager will view the Earth through 16 different wavelengths (or spectral bands) ranging from visible to infrared. A GOES-R education document put it like this: “It’s as if the imager has 16 different types of sunglasses, each one allowing only a certain wavelength...of light to come through.” Those 16 different spectral bands include two visible channels, four near-infrared channels, and 10 infrared channels. That’s a big step up from the current GOES imager, which can only see in 5 bands total.
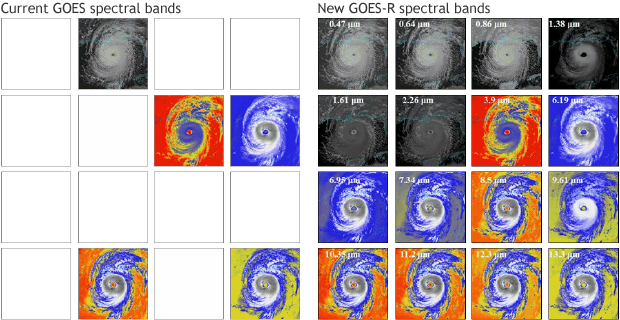
Graphic showing simulated imagery of Hurricane Katrina on the 5 channels of the current GOES imager (left) vs the 16 channels on the GOES-R imager (right). Credit: CIMMS AWG Proxy Team/SSEC/UW-Madison.
It’s not just NOAA that’s improving imager capabilities. According to Goodman, the European, Japanese, South Korean, and Chinese meteorological agencies are introducing higher spatial resolution on their latest satellites. “All of the global geostationary satellites are going to go from 5 to 16 channels,” said Goodman. “That will give us better resolution and more accurate data all around the world.”
Five times faster
In addition to giving scientists more wavelengths to choose from, GOES-R will be able to scan the Earth five times faster than the current system. To put that in perspective, this satellite can scan the entire Western Hemisphere as often as every 5 minutes. “When severe weather, hurricanes, and other rapidly evolving environmental phenomena form, scientists and satellite operators can switch the satellite into a regional rapid-scan operating mode and capture images updated as quickly as every 30 seconds, compared to every 7 minutes or more with the current GOES technology in rapid-scan imaging mode,” ABI Imagery Team Lead Tim Schmit said in an email. “With GOES-R, meteorologists and forecasters will have weather data as it happens to work with.”
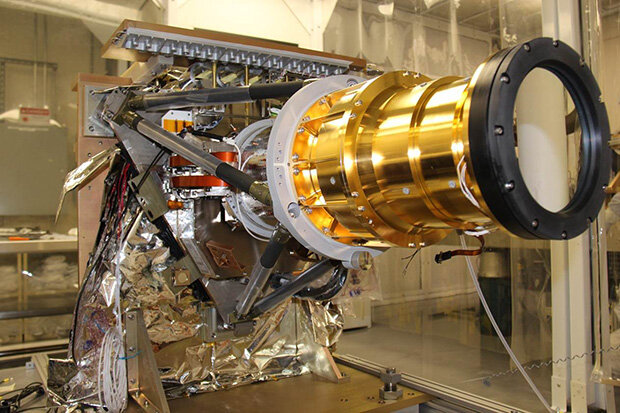
Artist's Rendition of GOES-R's Advanced Baseline Imager. Credit: ITT Exelis
One big problem with the current GOES imager is that if scientists wanted to highlight an individual, high-impact weather event, they have to stop scanning the rest of hemisphere. “With the new ABI adaptive imaging capability, we don’t have to cut off South America anymore,” said Goodman. “We can keep scanning the whole Western Hemisphere.”
Satellites in low-Earth orbit get snapshots of the globe two or four times a day. The current GOES imager gets a full-disk (entire hemisphere at once) image up to 8 times daily. GOES-R has four different operating modes, but it the default mode will take at least 4 full-disk images an hour: 96 in a day. “And we can monitor the faster changing weather or the evolution of clouds at four times the resolution [geographic detail] that we had before,” said Goodman.
Climate and clouds
About one third of the imager’s derived products are cloud-related. This is because clouds play such a vital role in the Earth’s weather and climate system by regulating the amount of energy that reaches and leaves the planet. The more heat energy trapped beneath cloud cover, the warmer the climate grows. The more solar energy reflected back into space, the cooler the climate. Whether the cooling or warming effect dominates now—and whether that will change in the future—is a major source of uncertainty about future climate.
With the new imager’s higher resolution and near continuous observations, “we expect to unravel a lot more detail about clouds, the climate, and the role of clouds in the climate system,” said Goodman.
In fact, 12 of the imager’s 16 bands can be used to monitor cloud properties. During the onset and development of extreme weather events, scientists have found that rapid growth and cooling at the tops of clouds are indicators of the potential for severe weather. Using the infrared bands, the imager can show more detailed changes in cloud-top features, helping scientists assess the potential size and severity even before a storm reaches its peak and bolstering existing weather radar systems.
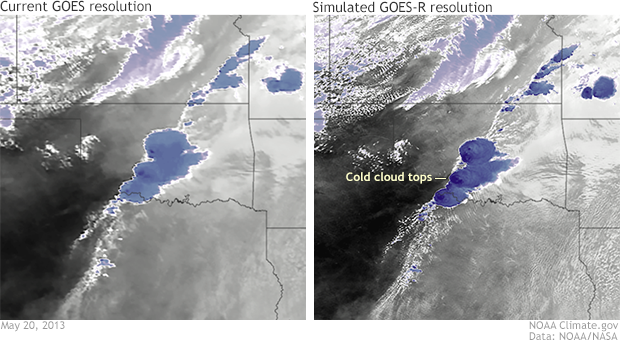
Resolution 4km of current GOES infrared band (left) and a simulated image of the 2km resolution from GOES-R's imager (right). Credit: NOAA Climate.gov via data from NOAA (left) and NASA/MODIS (right).
The higher-resolution data is going to help on the ground, as well, with wildfire detection. “With four times better resolution, what used to look like one large fire will now better pinpoint individual fires.” The ABI 3.9 micron [heat-detecting] channel is more sensitive, and the saturation temperature increases from 350K to 400K, allowing scientists to more accurately calculate fire radiative power as well as the location of fires and hot spots.
Other beneficiaries of GOES-R’s improvements are climate and weather modelers. The first global climate models were very different than what we have now and were designed to simulate only the circulation of the atmosphere. Over time, as better data and more computing resources became available, ocean, cloud, land surface, ice, snow, and other features were added.
Modelling grids are often less accurate in simulations because there isn’t any data on what is happening at a particular location or altitude at any given time. With the ABI’s new (and improved) data, climatologists will be able to incorporate three times more spectral information at four times greater resolution into future models.
“Not only are we getting useful operational products [from GOES], but we’re helping the models improve,” said Goodman.
Mapping Lightning
The GOES-R Geostationary Lightning Mapper (GLM), Credit: Lockheed Martin.
GOES-R’s other Earth-facing instrument, and the GOES-R instrument that Goodman himself is most excited, is the Geostationary Lightning Mapper (GLM). The GLM works by taking 500 images per second and comparing each individual pixel to capture the origin and extent of a lightning flash. Mapping the initiation and proliferation of each flash, the mapper will detect in-cloud, cloud-to-cloud, and cloud-to-ground lightning activity throughout the day and night. Often, the frequency of lightning within a storm will rapidly increase ahead of other severe weather indicators like precipitation, high winds, and hail, which can be picked up by ground-based weather radars. The ability to spot lightning early could add minutes of valuable warning time in advance of tornadoes and severe thunderstorms.
“I’m looking forward to the lightning mapper because I began work on it in 1979,” said Goodman, who added that he’s interested to see what another 20 years of lightning observations from space will add to the 17 years of existing lightning data collected in low earth-orbit from NASA research satellites.
The aviation industry is also looking forward to the Lightning Mapper. Current ground-based radar systems don’t cover trans-oceanic routes, and the detection systems on planes frequently can’t look past the horizon. At a storm-scale resolution of about 10 kilometers (about 6 miles), GOES-R’s mapper will measure total lightning activity over the Americas and the adjacent ocean regions. Combined with the advancements of the ABI, the mapper will benefit pilots and dispatchers with more accurate and timely weather hazard information.
Goodman added that the new data from the mapper might provide some new information about lightning formation during climate events like the El Nino-Southern Oscillation (ENSO). During the strong 1997-1998 El Nino event, scientists measured twice as many days with lightning off the U.S. Gulf Coast, compared to a normal year.
“As we have another 20 years of observations from the lightning mapper, we’ll be able to see if we have changes in the structure, frequency, distribution, or trends of storms and extreme weather, and perhaps serve as an additional indicator of inter-annual to decadal changes in thunderstorms or their intensity,” said Goodman. “That should add something to our knowledge of the climate system.”
What’s next?
GOES-R reached orbit—22,300 miles above Earth—on November 29 and officially changed its call sign to GOES-16. On December 8, it will begin 30 days of “outgassing” to make sure that there are no contaminants on the detectors or the instruments. NOAA scientists won’t actually open up the telescope doors and start testing the instruments until around Day 48. The public can expect to see their first GOES-R images in early 2017 with regular images available in the spring, said Goodman.
It’s not clear yet whether GOES-R will replace GOES East (75oW) or GOES West (137oW), but Goodman said that decisions should be made by summer. GOES-S, the next satellite of this generation, is planned to launch in 2018. If all goes as planned, the four GOES-R series satellites, –R, –S, –T and –U, will continue NOAA’s geostationary coverage through 2036.
References
GOES-R Homepage: www.goes-r.gov
Product Overview: www.goes-r.gov/products/overview.html
NESDIS GOES-R: www.nesdis.noaa.gov/GOES-R-Spacecraft
NESDIS: 6 Reasons Why NOAA's GOES-R Satellite Matters
Walsh, J., D. et al. 2014: Appendix 3: Climate Science Supplement. Climate Change Impacts in the United States: The Third National Climate Assessment, U.S. Global Change Research Program, 735-789. doi:10.7930/J0KS6PHH.