La Niña's influence on seasonal climate is strongest and most obvious around the tropical Pacific, where the phenomenon occurs. But the Pacific is the world's biggest ocean, and when its climate teeters, the entire atmosphere can lose its balance. In the United States, La Niña's strongest and most consistent influence is a drier-than-usual winter across the Southeast. The maps below show the average influence of La Niña on winter precipitation (top) and temperature (bottom) across the United States during events that have occurred in the past 60 years.
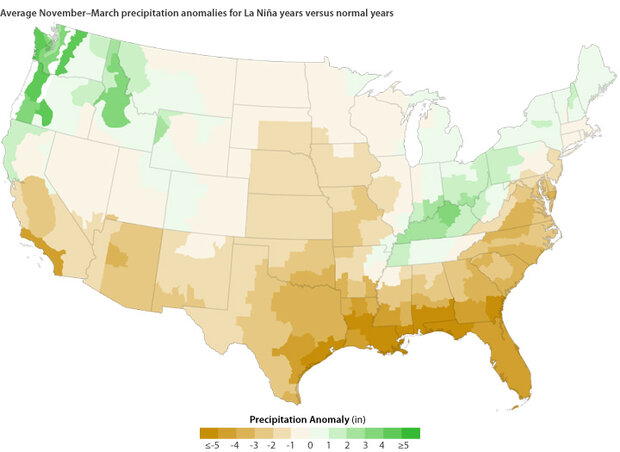
The map shows difference from average winter (November–March) precipitation during La Niña years (1954, 1955, 1964, 1970, 1973, 1975, 1988, 1999, 2007) compared to the long-term average (1971-2000) of normal years. (Maps by Hunter Allen and Ned Gardiner, based on Climate Division data from NOAA’s National Climatic Data Center and analysis by the Physical Sciences Division of NOAA’s Earth System Research Lab.)
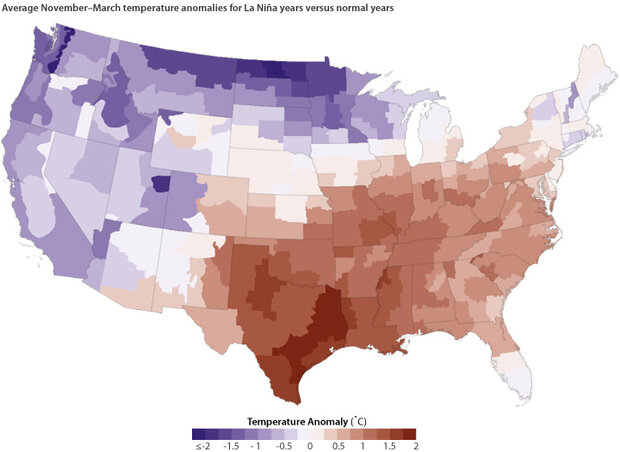
The map shows difference from average winter (November–March) temperature during La Niña years (1954, 1955, 1964, 1970, 1973, 1975, 1988, 1999, 2007) compared to the long-term average (1971-2000) of normal years. (Maps by Hunter Allen and Ned Gardiner, based on Climate Division data from NOAA’s National Climatic Data Center and analysis by the Physical Sciences Division of NOAA’s Earth System Research Lab.)
Weather in the Southeast this fall and winter is keeping up with the dry part of the La Niña pattern. According to the National Climatic Data Center, precipitation across most of the Southeast was "below" or "much below" normal for October-December. Temperature, meanwhile, wasn't marching to the La Niña tune, with much of the Southeast cooler than normal because of other climate factors.
The dryness over the Southeast is often associated with the Pacific-North American (PNA) climate pattern. In the pattern's negative phase, the general flow of the atmosphere gets "stuck" in a wave train that repeatedly brings higher-than-normal pressure to the North Pacific, lower-than-normal pressure to western Canada, and, farther downstream, higher-than-normal pressure to the Southeast. High pressure generally results in dry skies.
Although the Pacific-North American pattern can seesaw independently of El Niño or La Niña events, La Niña events tend to push it into its negative phase. (El Niño events tend to push it into its reversed phase.) The connection between the two phenomenon can be traced back to the way La Niña disturbs the entire atmospheric circulation in the Pacific north of the equator.
The atmosphere flows around the Earth like water in a river. When something disturbs the flow, waves appear downstream. Tropical convection-the persistent belt of clouds and storms near the equator-is one of the major "disturbers" of atmospheric flow. During La Niña, tropical convection retreats to the western Pacific, usually for months. The long-lasting geographic shift in tropical convection changes the atmospheric flow over the North Pacific sort of like moving a boulder would change how the water flows in a river.
![]()