On Sunday August 18, 2024, a slow moving front accompanied by training storms brought extreme amounts of rain to parts of the Northeast which led to catastrophic flooding. The worst of the flooding occurred in southwestern Connecticut and Long Island, New York, where more than 10 inches of rain fell in a 24-hour period. The National Weather Service issued flash flood emergencies, which are warnings reserved for exceedingly rare situations in which extreme rainfall is leading to a severe threat to life and catastrophic damage. During the extreme rainfall event, mudslides washed out roads, streets were inundated with flood waters, and swift-water rescues were necessary.
The highest 24-hour rainfall totals were 14.83 inches and 13.5 inches near Oxford, Connecticut. Both values are under further quality control review by a State Climate Extremes Committee to determine if either location officially broke the 24-hour state rainfall record for Connecticut. The previous record was 12.77 inches set on August 19, 1955, from Hurricane Diane. If the high-end total is confirmed, it would qualify as a 1-in-1,000-year extreme rainfall event, based on NOAA’s point precipitation frequency estimates. A 1-in-1,000-year event does not mean that these events can only happen once every 1,000 years, but that over long periods of time, the average return frequency would be every 1,000 years. It also means that statistically speaking, there is only a 0.1 percent chance of a rainfall event of this magnitude occuring at this location in any given year. Sandy Hook, Connecticut, just west of Oxford, picked up just over a foot of rain qualifying as a 1-in-500-year event.
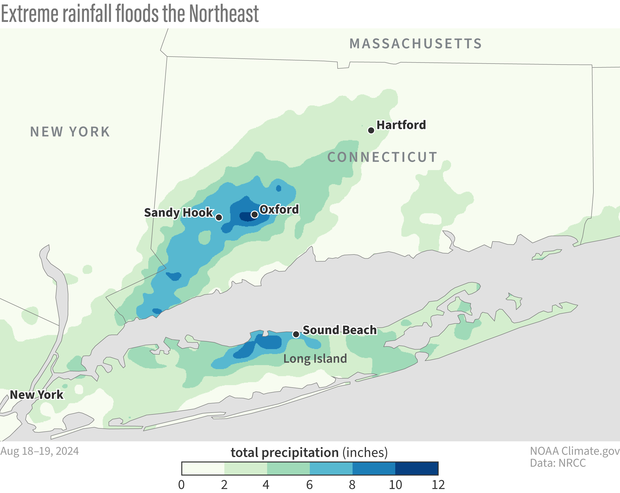
Total rainfall over parts of New York and Connecticut estimated from radar for the two-day period from August 18–19, 2024. In Connecticut, some rainfall totals during this event are under investigation for setting a new record for most rain observed in a 24-hour period. NOAA Climate.gov image, based on data provided by NOAA Northeast Regional Climate Center.
Less than 12 hours later, as the slow-moving front pushed east, more training storms set up about 30 miles south along Long Island, bringing extreme rainfall to the region. More than 10 inches of rain was reported by a National Weather Service employee near Sound Beach, qualifying as a 1-in-200-year rainfall event.
Could extreme rainfall across the Northeast be the “new normal”?
This was not the first extreme rainfall event to happen across the Northeast this summer. There have been at least three other extreme rainfall events that have produced at least one 1-in-200-year rainfall event, two of which were associated with the remnants of Hurricane Beryl and Hurricane Debby. The third was an extreme rainfall event across northeastern Vermont on July 30, which resulted in at least two 1-in-500-year rainfall events.
Every extreme rain event has a variety of causes and influences; increasingly human-caused climate change is one them. According to the Fifth National Climate Assessment (NCA5), precipitation across the Northeast is increasing across all seasons, and extreme precipitation events have increased nearly 60 percent in the region–the largest increase in the United States. The report states that some of these changes may in part be due to tropical systems, but also note that there is more overall water availability (in the air) throughout the region due to warming temperatures (warmer air is able to hold onto more water).
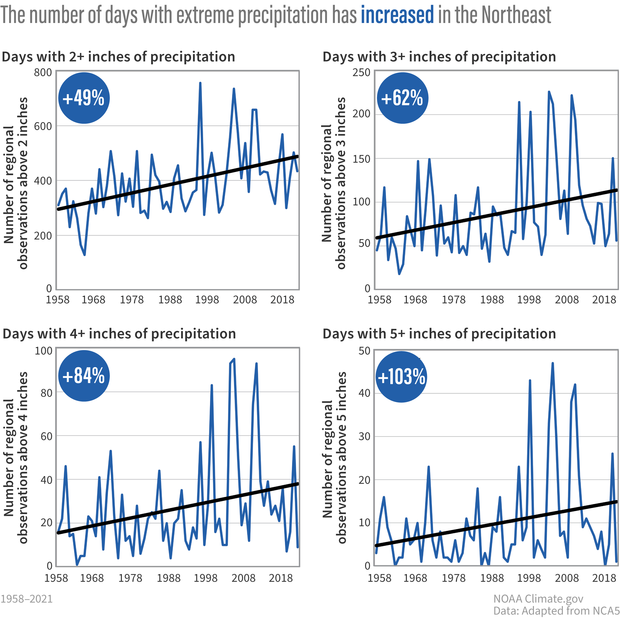
The four charts show the number of daily events per year with precipitation totals equal to or exceeding 2, 3, 4, and 5 inches from 1958–2022 (blue lines), along with trend lines (black) computed from linear regressions over the full period. Numbers in the top left corner show the percent increase relative to the long-term average, computed as the difference between the end points of the trend lines divided by the 1958–2022 average. The number of daily events is defined as the total number of extreme precipitation accumulations recorded at all stations across the observing network in the Northeast. See the figure metadata for details on the methodology. The trends shown suggest an increase in the frequency of extreme precipitation, with larger increases for the more extreme precipitation events. Figure adapted from original in the Fifth National Climate Assessment.
The blue lines in the graphs above show the number of days per year in the Northeast with extreme precipitation. The trend lines (black) show the overall increase in frequency of these extreme precipitation days over the last several decades, with even larger increases for more extreme precipitation events. Extreme precipitation events of all sizes are occurring more often now across the Northeast, and the scales are tipped even more toward the highest-end precipitation events—those that tend to have large impacts on people, lives, and property.
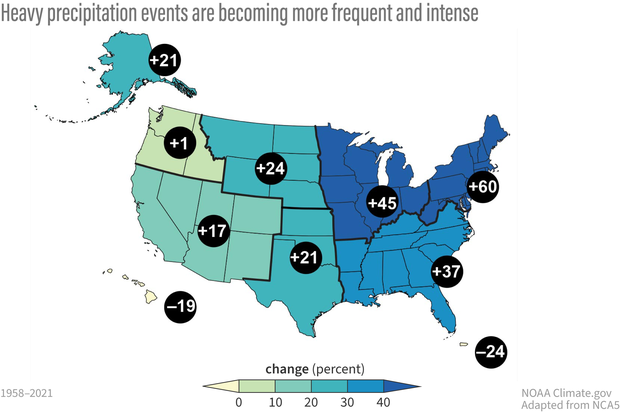
The frequency and intensity of heavy precipitation events have increased across much of the United States, particularly the eastern part of the continental US, with implications for flood risk and infrastructure planning. Maps show observed changes in three measures of extreme precipitation: (a) total precipitation falling on the heaviest 1% of days from 1958–2021. Numbers in black circles depict percent changes at the regional level. Data were not available for the US-Affiliated Pacific Islands and the US Virgin Islands. Image adapted from original in the Fifth National Climate Assessment.
NCA5 also concluded that there is “robust evidence that human-caused warming has contributed to increases in the frequency and severity of the heaviest precipitation events across nearly 70% of the U.S.” The report also states paleoclimate records indicate that summer moisture has increased over the past century in parts of New England, the central-eastern United States, and the northern Mississippi River Valley. If the globe continues to warm, more changes in precipitation are likely and will vary by location. According to NCA5, additional increases in annual precipitation are expected with every degree of warming across the Northeast.