In last week’s post, we described how truly astounding the March 25-26 rainfall totals across the Atacama Desert in northern Chile and southern Peru were. Rainfall totals of one to two inches across the desert are usually seen only after multiple years’ worth of accumulations, not in 24 hours.
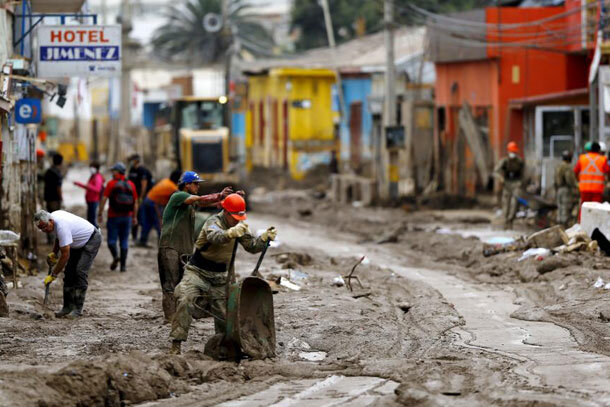
People remove mud from the streets after flooding at Chanaral town in Chile, on April 8, 2015. Photo from Reuters/Ivan Alvarado.
Rare events often mean that not only did the atmosphere look incredibly different than normal, but also that a series of strange events coincided with each other. That was definitely the case here.
Why the Atacama so dry
The Atacama Desert’s dryness is not over-hyped. The desert’s latitude, altitude, and close proximity to the Andes Mountains and the cold Humboldt Ocean Current conspire to keep precipitation away.
During the summer and early fall for the Southern Hemisphere, a high pressure system is generally located over the region (20-30°S). With its counter-clockwise winds and sinking, dry air, the high suppresses rainfall. Occasionally a few drops make it over the Andes Mountains from the east. The high pressure acts like a wall to the north, keeping low pressure systems—with their rising air and precipitation—closer to 40°S.
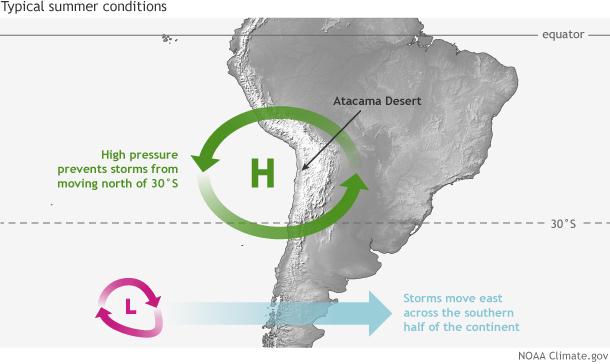
A persistent high pressure system camps out over west-central South America during Southern Hemisphere summer, keeping low-pressure systems from moving north of about 30°S. NOAA Climate.gov schematic by Fiona Martin.
A weak high, a cut off low, and rapid ocean warming
Suffice it to say, this usual pattern was non-existent during the end of March. The blocking high pressure to the north weakened and drifted east. To the south, a low pressure system was “cut-off” from the normal west-to-east flow and left to wander on its own to the north and then east, like a blob of lava getting pinched off in a lava lamp and slowly drifting upwards.
Instead of being blocked by a strong high pressure to the north, the low meandered much farther north than usual. Guiding its meandering and not allowing the low to move to the southeast, a series of high pressure systems developed to the south and west ,while the Andes Mountains hindered movement to the east. Instead, the low tracked east-northeast towards the Atacama Desert.
As the low moved closer to the central Chilean coastline, northwest winds on the northeast side of the low pressure were enhanced by the counter-clockwise flow surrounding high pressure systems to the north and northeast (as well as some funneling effects due to the topography of the southern Peruvian Andes). These enhanced northwest winds tapped into moisture in the tropics and dragged it right to the desert. The animation below shows how all these events came together.
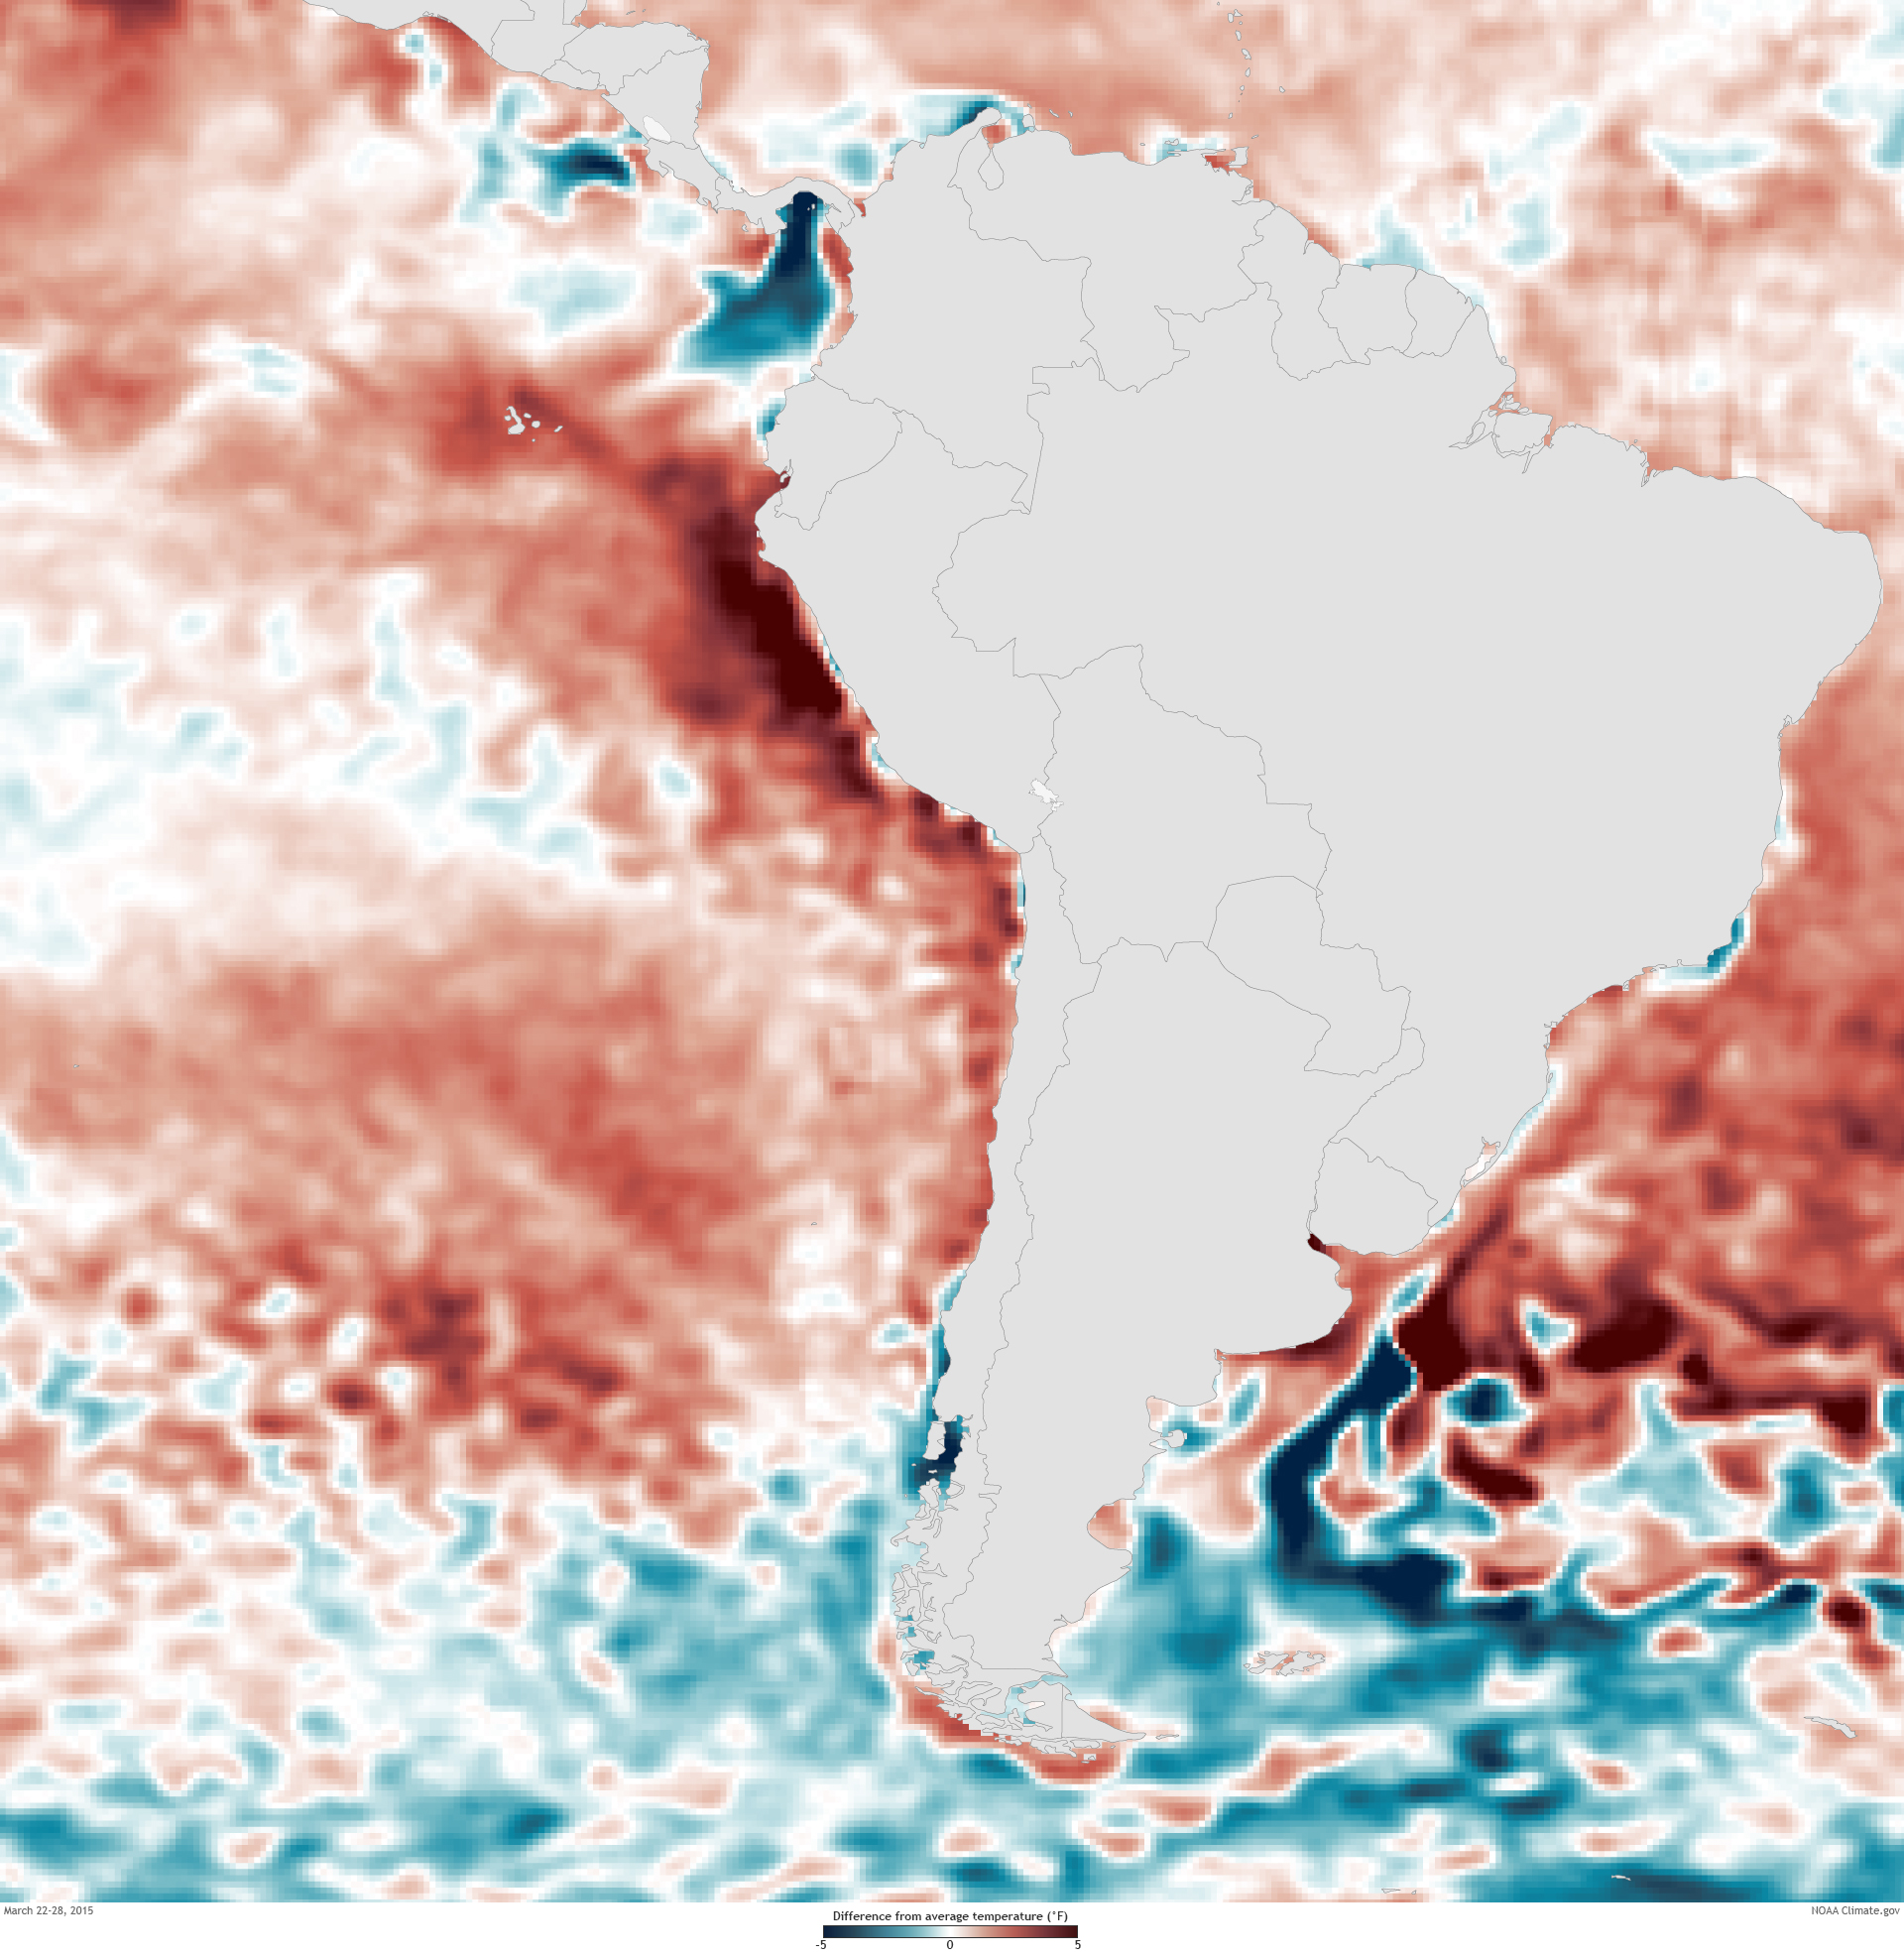
Those circumstances alone would have been enough to generate above-average rains, but to make this event even more uncommon, the northwest winds were picking up tropical moisture over an area of ocean that had warmed rapidly (over 2°C in some locations) during the prior week. It just so happened that the southeast trade winds across the tropics had weakened and even reversed preceding this event. This wind reversal reduced the strength of the region’s cool, upwelling Humboldt Current and led to a rapid warming of the sea surface. Warmer waters meant more potential moisture transferred into the air to be rained out over the Atacama Desert.
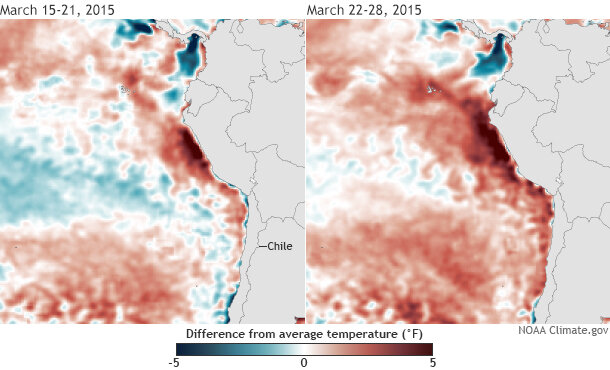
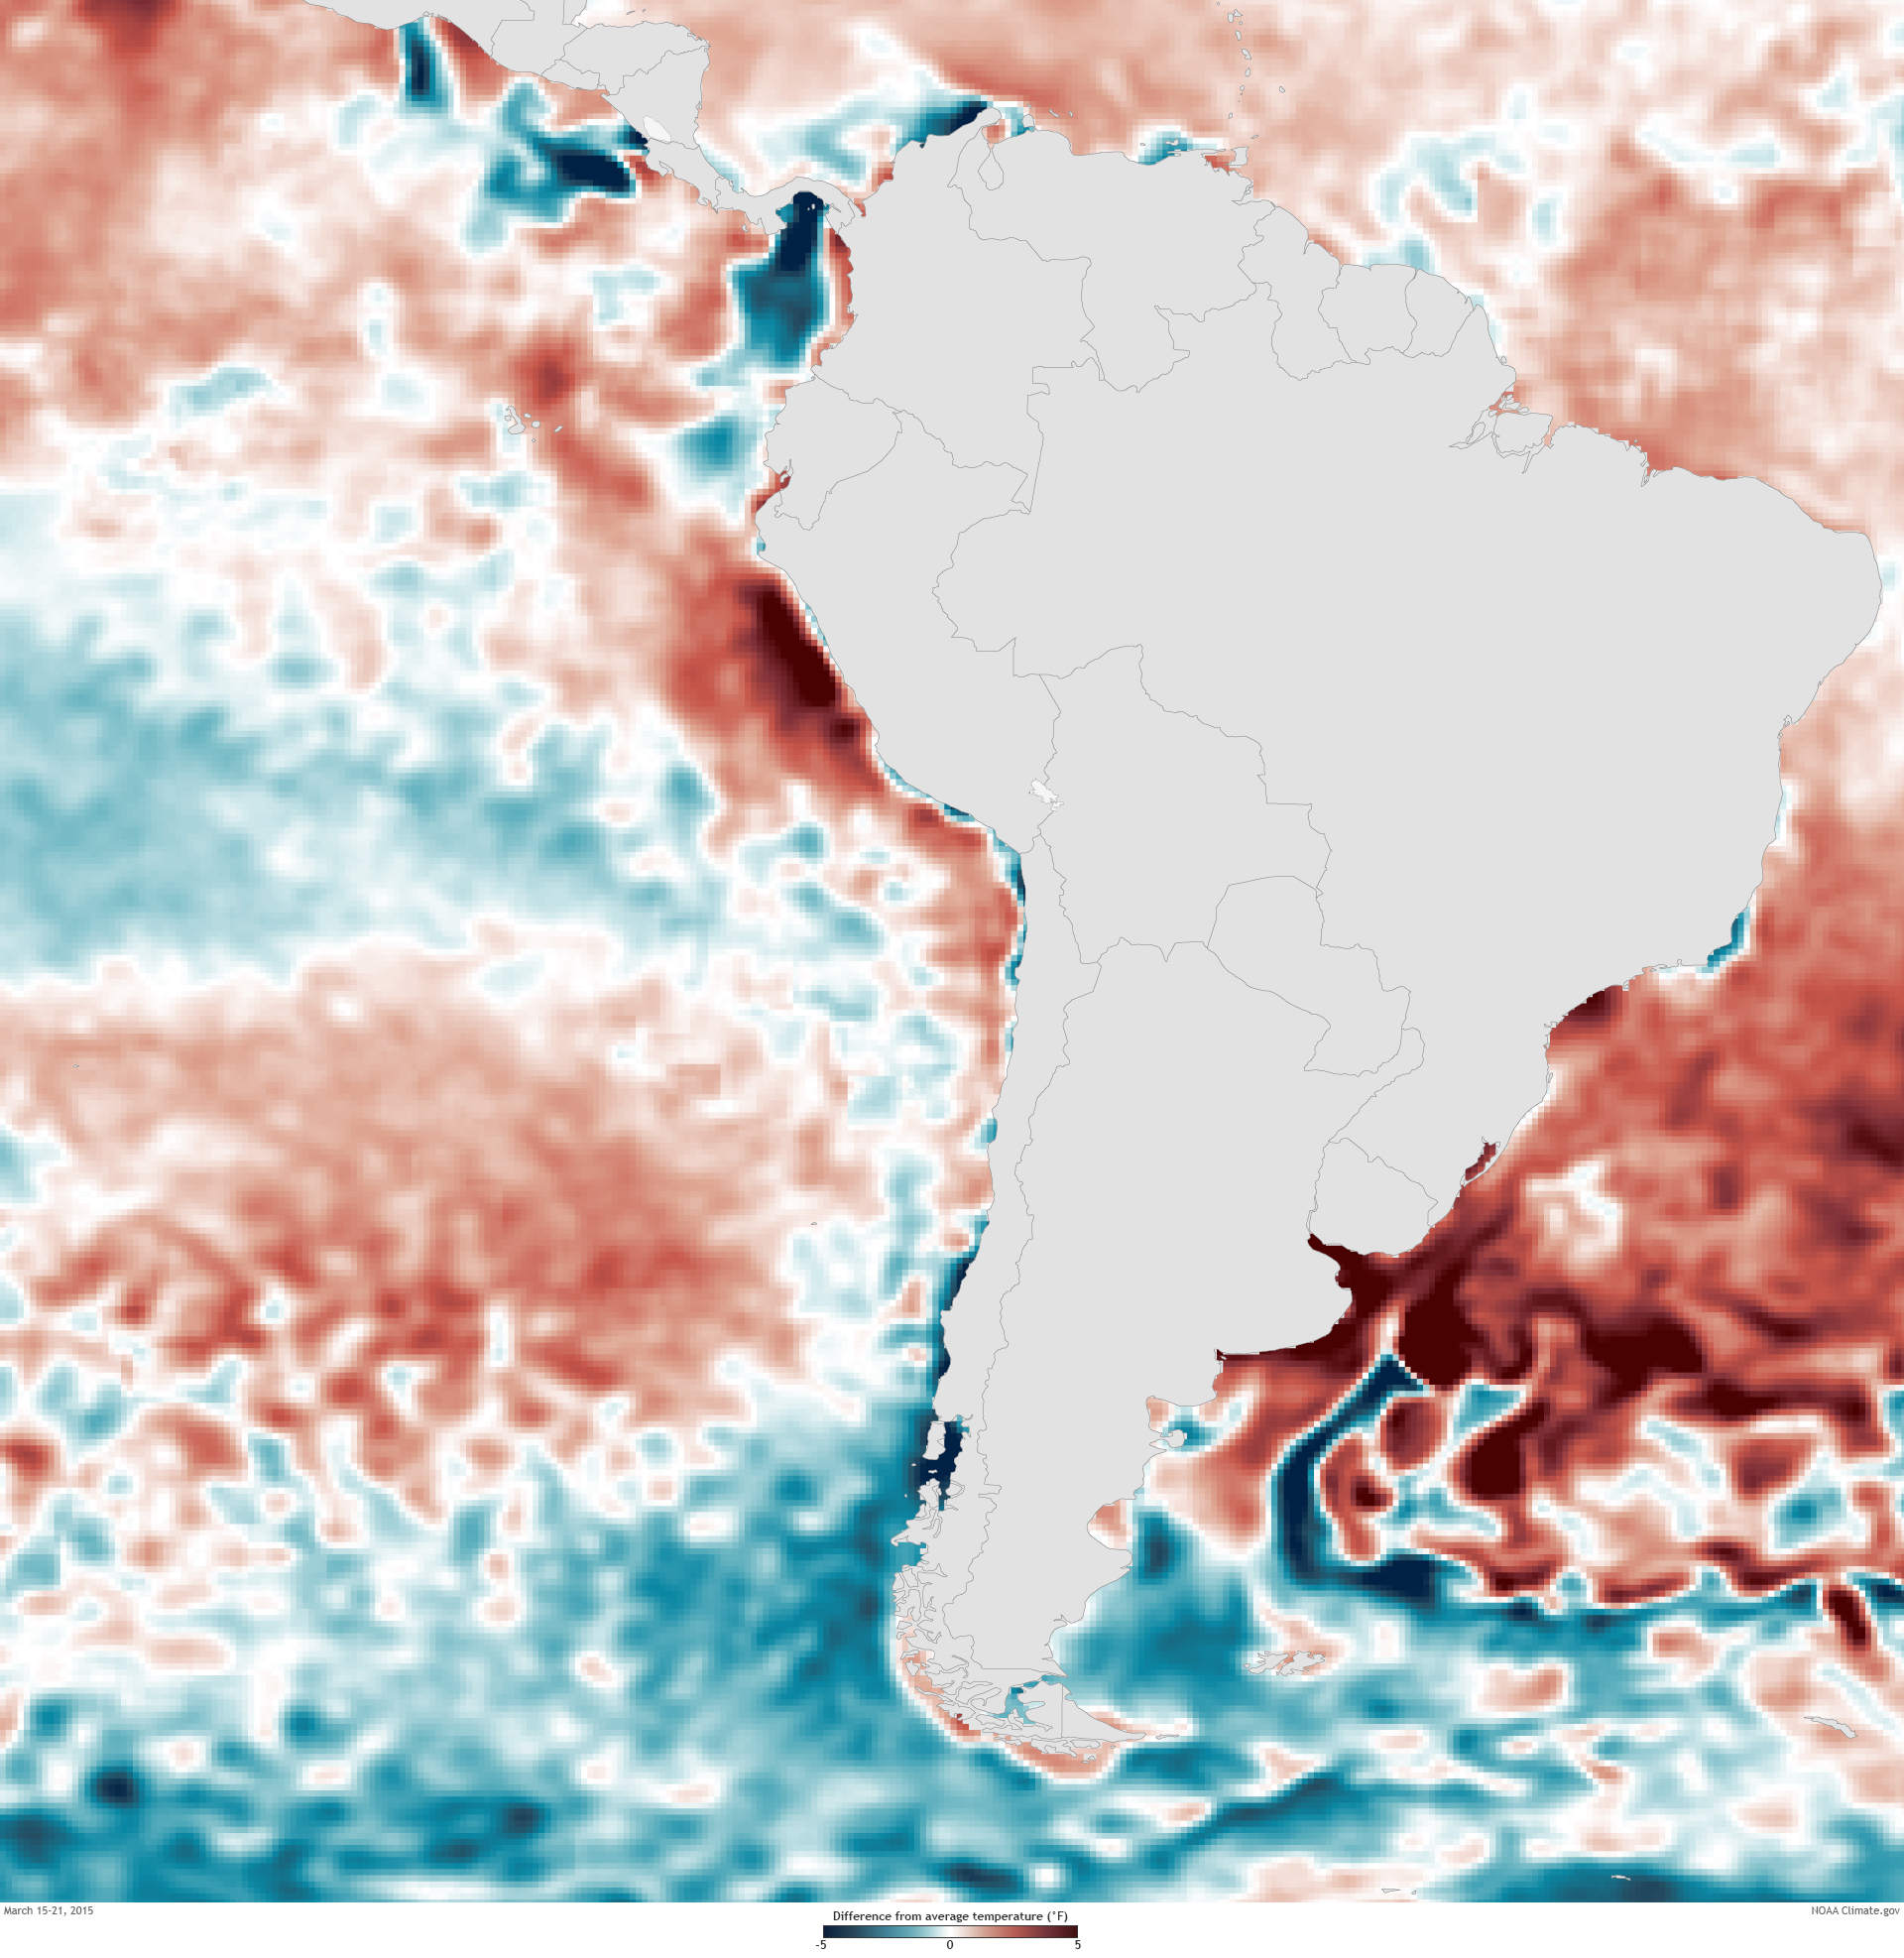
Difference from average sea surface temperature for the third and fourth week of March 2015. Increased evaporation due to rapid warming in the eastern tropical Pacific boosted the moisture available to the cut-off low pressure system over the Atacama Desert. NOAA Climate.gov image based on NOAA OISST sea surface temperature data.
large week 15-21 average image | large week 22-28 average image
Eventually this strange atmospheric pattern broke down. The low weakened and moved east along with the blocking high pressure systems. However, the damage had been done. The rains resulted in several deaths, $1.5 billion in damages, and an historic event that residents will likely remember for a lifetime.