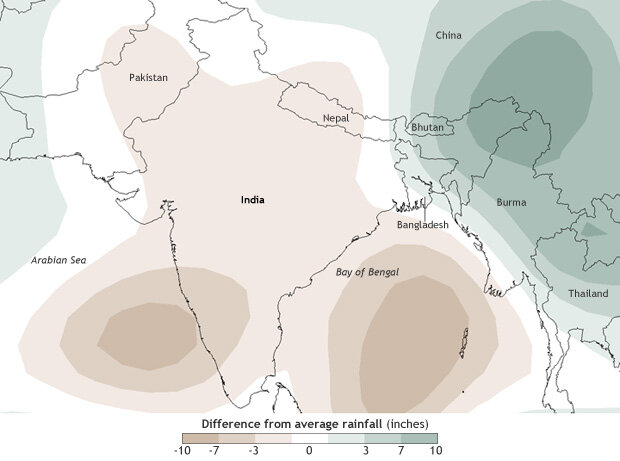
Difference from average rainfall from June–July 2012 compared to the recent historical average (1981-2010). Greens indicate 3-10 inches more rain than average; brown indicate 3-10 inches less rain than average. (Map by Dan Pisut, NOAA Environmental Visualization Laboratory, based on NCEP reanalysis data from NOAA’s Earth System Research Laboratory.)
The rainy season in India arrived late and delivered far less precipitation than usual in summer 2012, leading to severe drought across large parts of the country. More than 50 percent of the labor force in India—the world’s second most populous country—makes a living in agriculture. Compare that to the United States, where the figure is less than 1 percent, and you can start to imagine the widespread hardship that a drought can cause.
India’s rainy season (the rainy phase of the Asian monsoon) generally starts around June 1 at the southern tip of the country, and the rain clouds migrate north-northwest over subsequent weeks. When the rains failed to appear in June, the impact on vegetation was severe. Rain-watered crops failed to germinate, and forage for livestock withered.
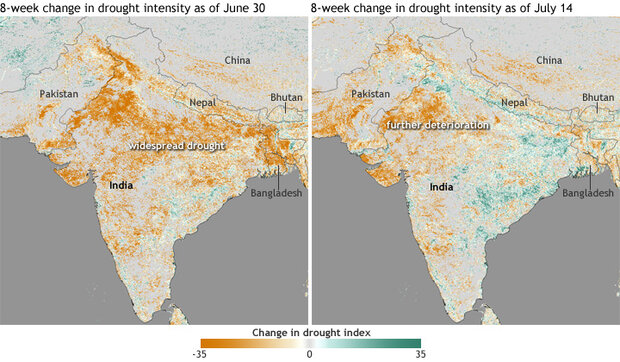
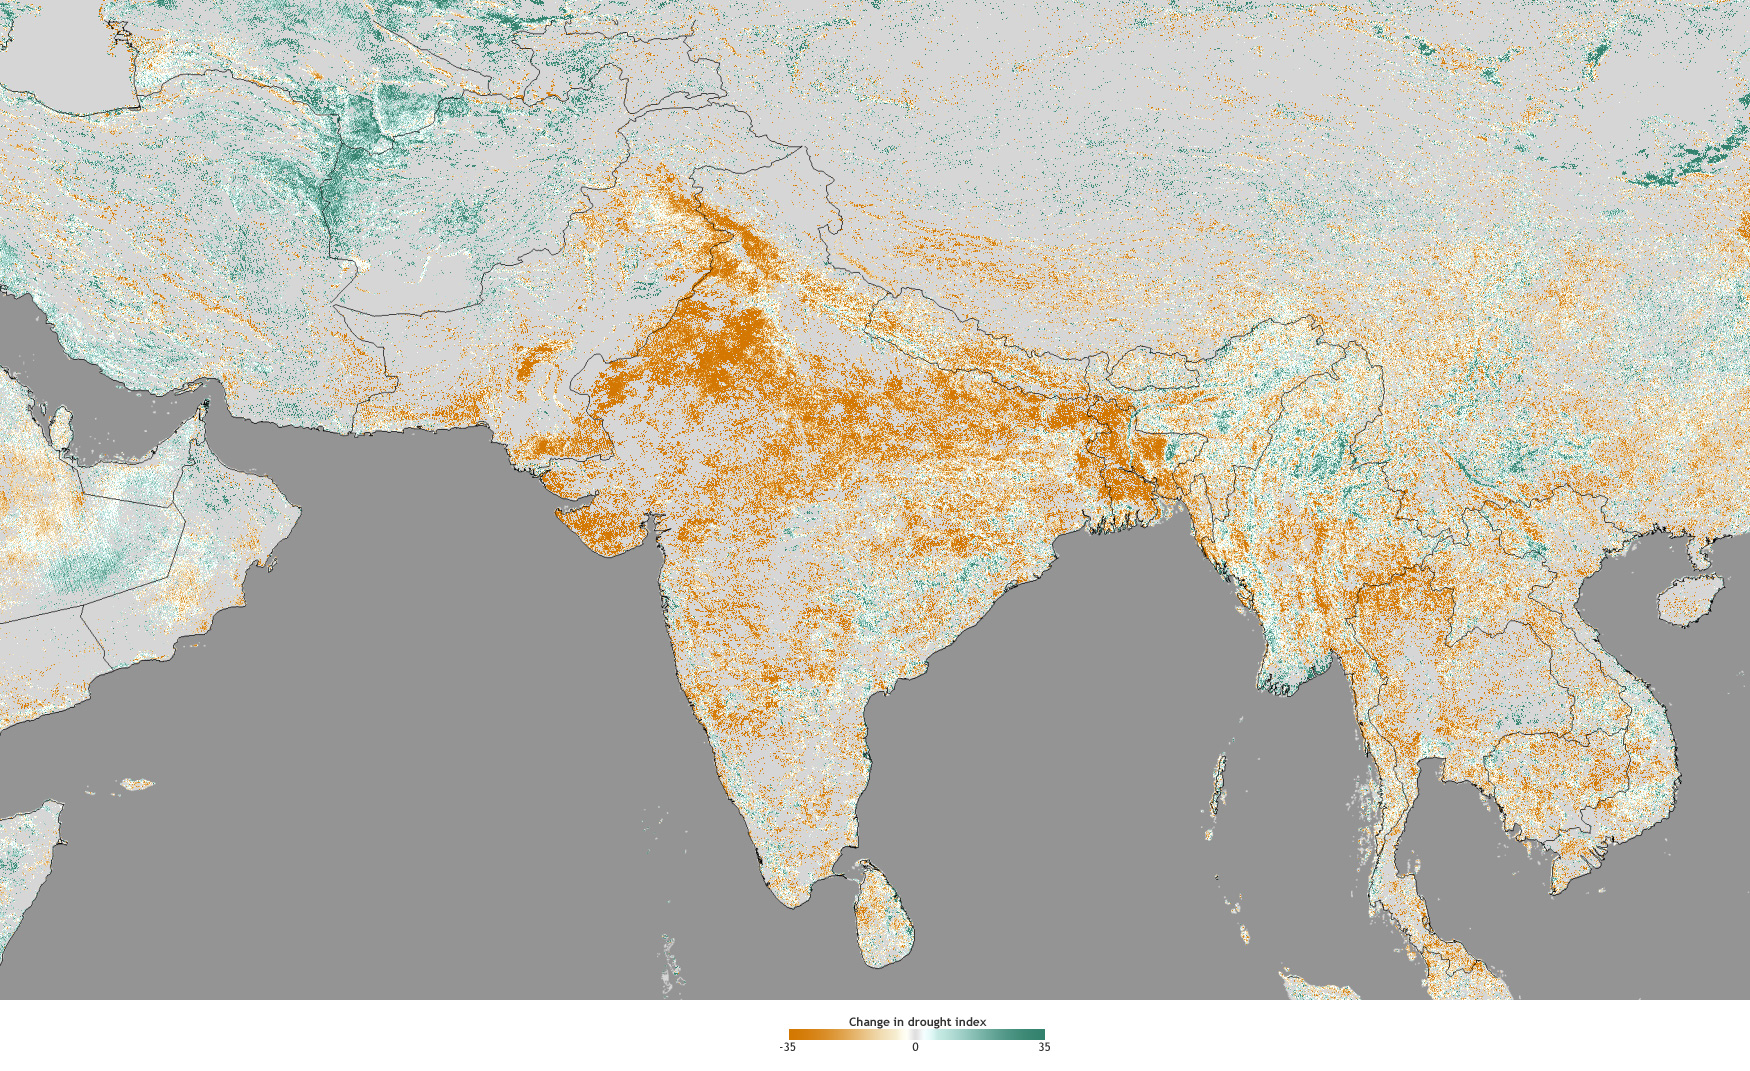
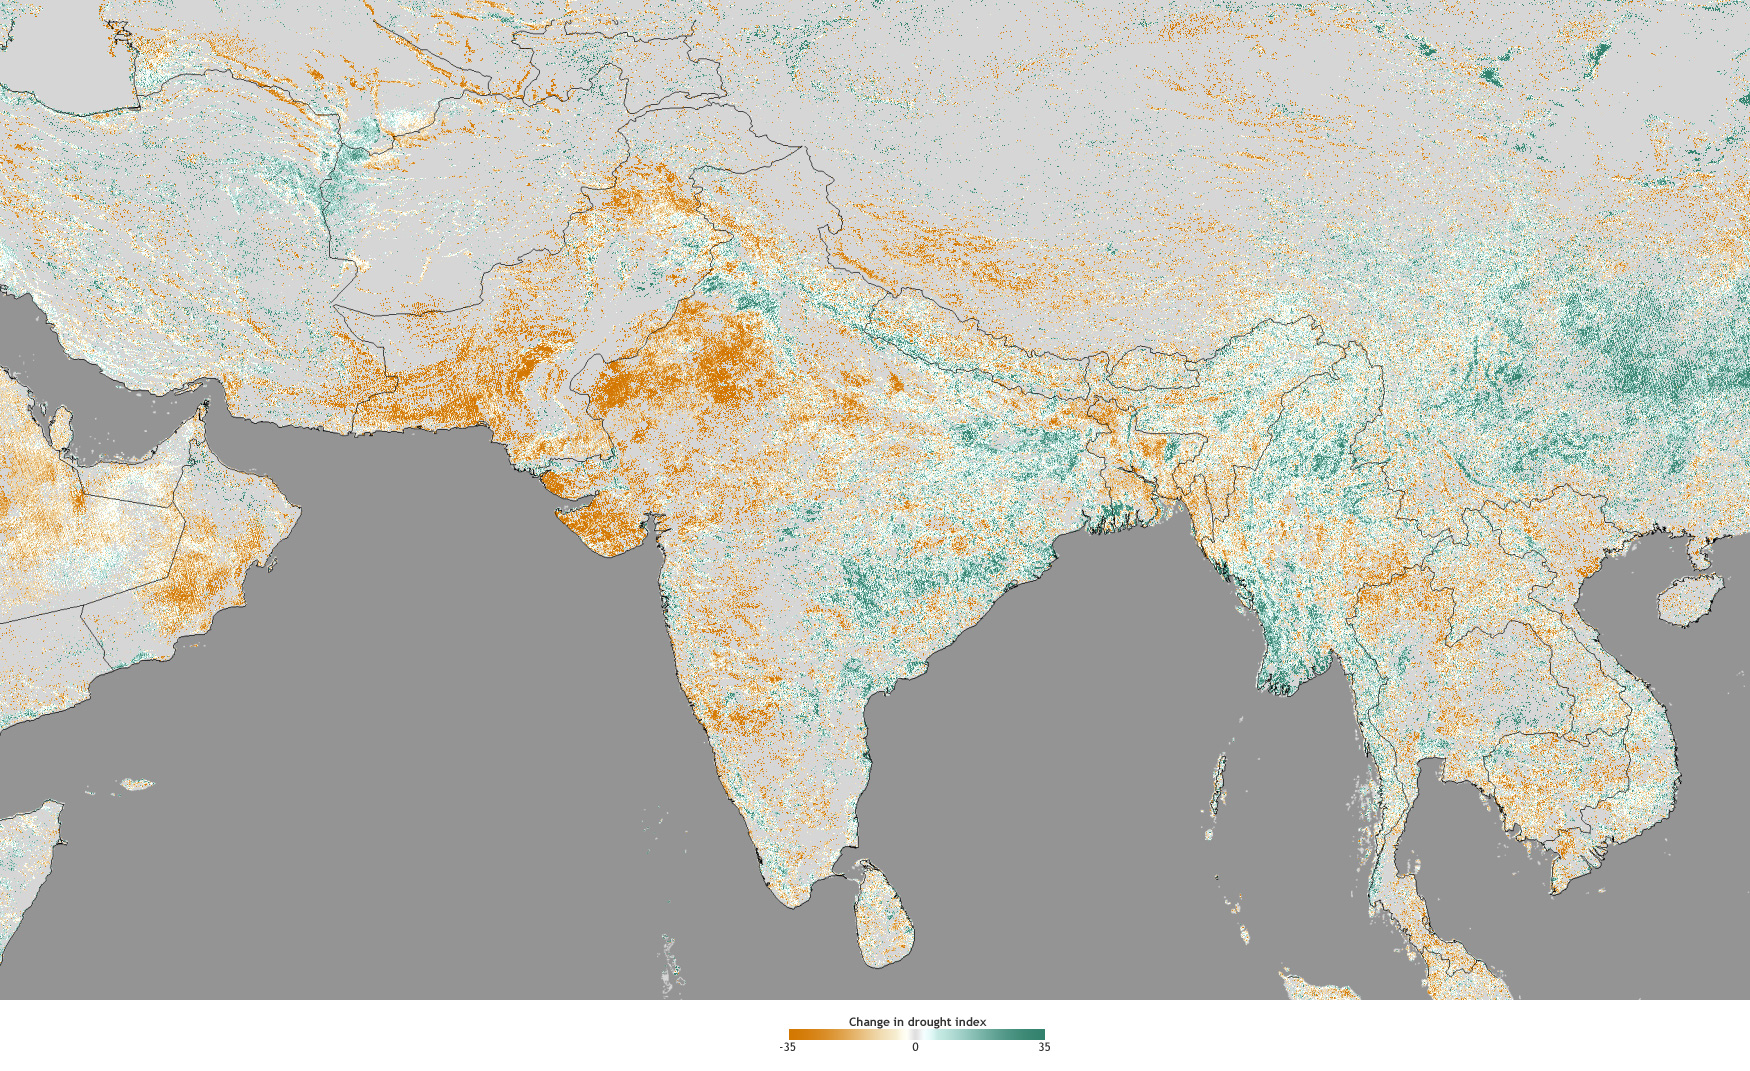
Satellite-based maps of changes in drought conditions over an 8-week period at the end of the first month of the usual rainy season (June 30) and two weeks into the second month (July 14). Greens indicate improvement. Browns indicate worsening. (Map by Dan Pisut, NOAA Environmental Visualization Laboratory, based on drought data from Felix Kogan at the NOAA Center for Satellite Applications and Research.) large maps: June 30 | July 14
The maps above show satellite-based estimates of the change in drought status after the first month’s failed rains (left) and again two weeks later (right), as the monsoon continued to be delayed. The colors represent changes in a drought scale that takes into account satellite observations of the relative "greenness" of vegetation on the ground plus moisture conditions and temperatures. Drought conditions were widespread across India by the end of June, and western areas deteriorated further through mid-July.
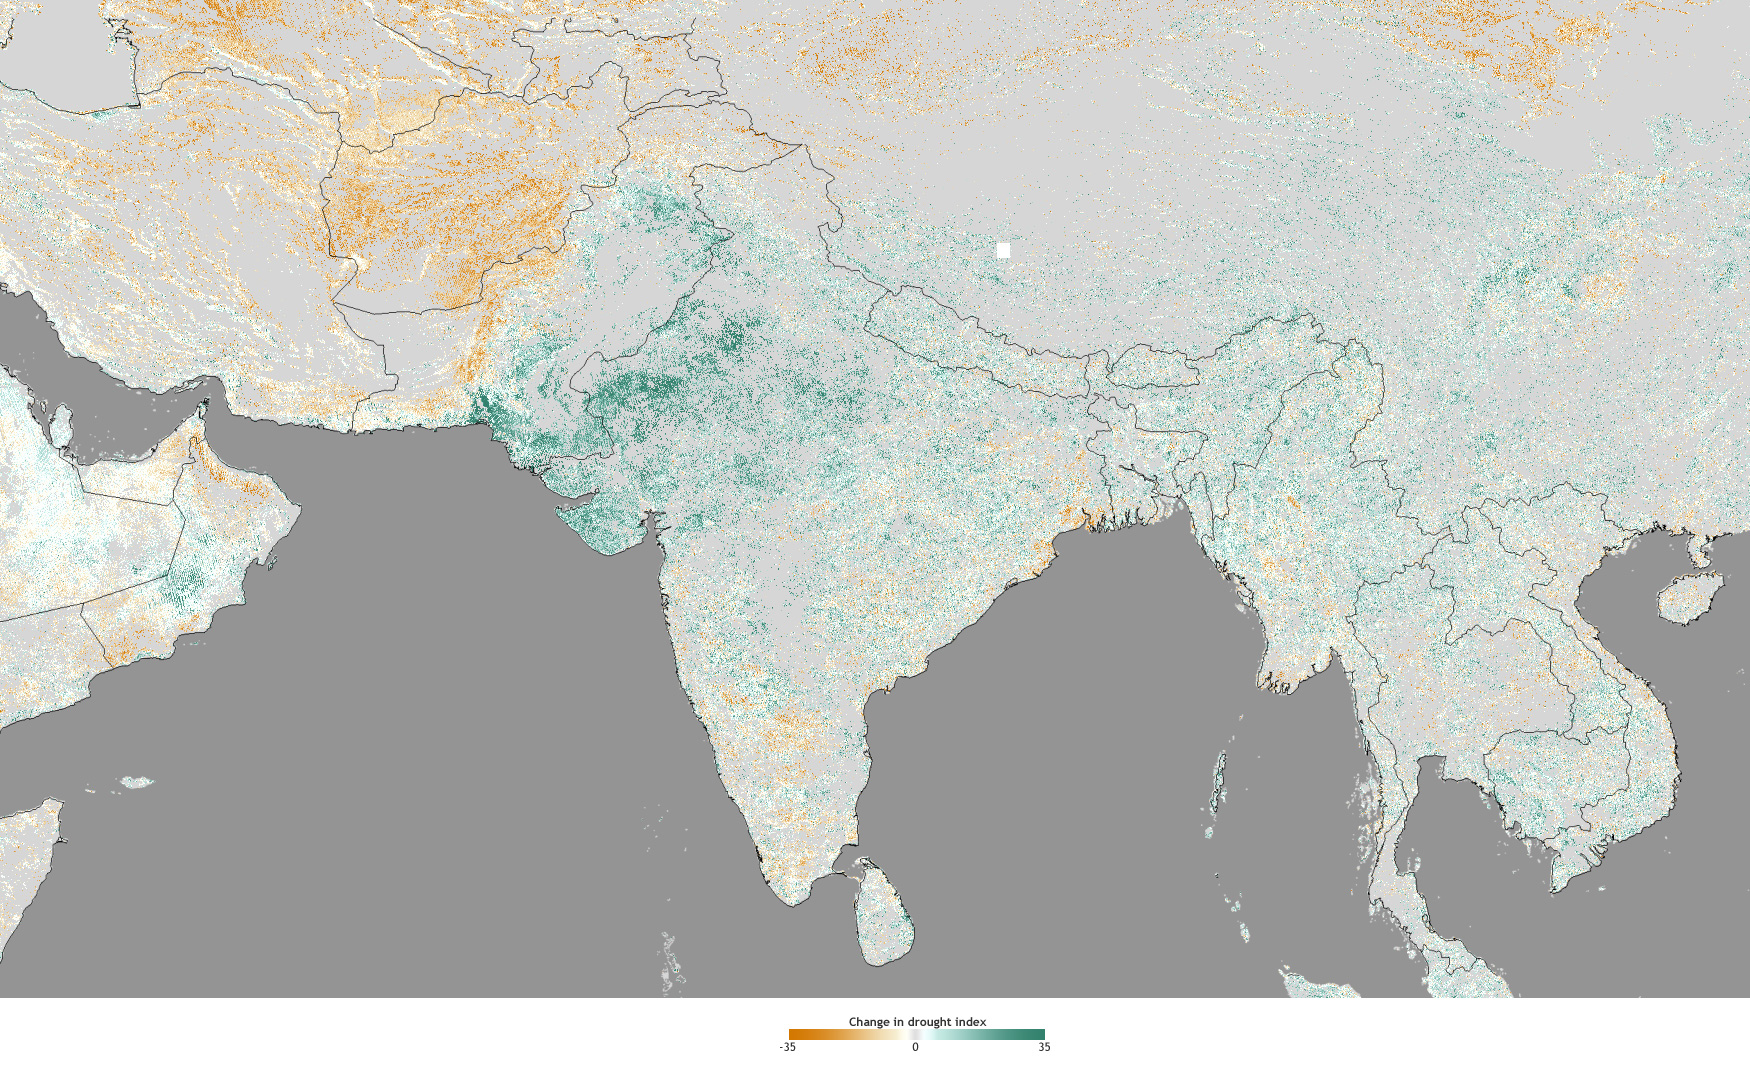
Rains finally arrived in August, and vegetation conditions showed some improvement (maps below). Rainfall in August (left) was heavier in the eastern part of the country and across Bangladesh (blue colors), with amounts tapering off in the west and north. Despite the heavier rainfall amounts in the east, it was the western part of the country—where drought conditions were more severe in preceding months—that witnessed the most improvement (green colors on right-hand map) according to the satellite observations.
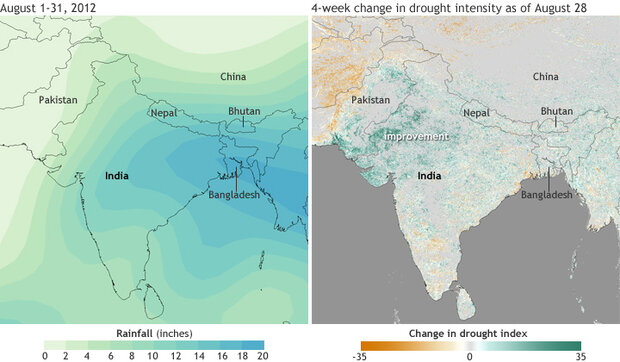
(Left) Total rainfall in August 2012, based onNCEP reanalysis data provided by NOAA Earth System Research Laboratory. (Right) Change in drought status over a 4-week period ending on August 28, 2012, based on drought data from Felix Kogan at the NOAA Center for Satellite Applications and Research. Greens indicate improvement. Browns indicate worsening. large maps: precipitation | drought change
As with drought across the United States, however, timing can be everything, and the August rains will in many cases be too late to prevent some crop and cattle losses. Despite the increased rainfall since late August, large precipitation deficits for the season continue in western India. For example, as of mid-September, Gujarat and Punjab had seasonal rainfall deficits of around 10 and 8 inches, respectively. The monsoon typically withdraws from western India during the latter half of September, and rainfall begins to decline.
References
Central Intelligence Agency. (2012). India: CIA World Factbook. Accessed September 16, 2012.
![]()