For two days in late February 2018, temperatures soared across the eastern United States to reach heights that might have reminded residents of early summer. Even though temperatures returned to normal soon thereafter, the early heat won’t be forgotten as numerous daily and monthly records were set up and down the eastern seaboard.
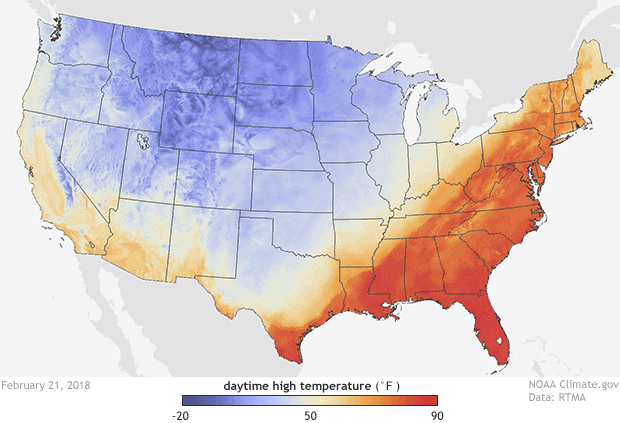
High temperatures across the United States on February 21, 2018 according to data from NOAA's Real-Time Mesoscale Analysis (RTMA). Summer-like temperatures were observed across the eastern United States, while the western half of the country observed below-average temperatures. Climate.gov image with data provided by NOAA's Environmental Visualization Lab, based on NOAA RTMA data.
Temperatures—both daytime highs and overnight lows—were well above average on February 20 and 21 across the eastern United States as warm air funneled in from much farther south.
On February 20, all-time February high temperature records were set in Pittsburgh; Indianapolis; Charleston, West Virginia; and Cincinnati as daily highs reached the upper 70s (80°F in Charleston). Each of those locations have records that go back to the late 1800s.
The same day also saw record high low temperatures set. For instance, it only fell to 66°F in Louisville, Kentucky, and 54°F in Rochester, New York—4 degrees warmer than the previous record. Meanwhile Lexington, Kentucky, set a new February record when the low only reached 62°F, breaking a monthly record set only six days previously.
The next day saw record-smashing temperatures stretch across the northeast. Montpelier, Vermont, hit 70°F, a new February record, which broke the previous daily record by 13°F! Other cities that broke monthly records included Harrisburg, Pennsylvania; Hartford, Connecticut; Portland, Maine; New York City; Dulles airport outside Washington, D.C.; Trenton, New Jersey; and Syracuse, New York.
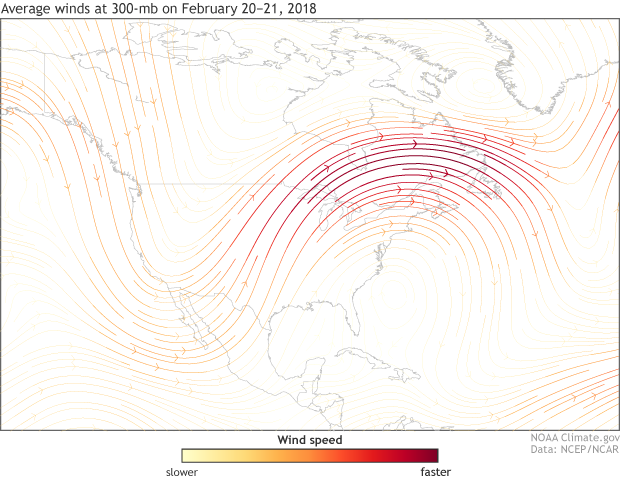
300-mb winds across the United States from February 20-21, 2018. The jet stream was extremely wavy with a trough over the western United States and a crest over the eastern United States. Record breaking temperatures were observed across the eastern United States during the period. NOAA Climate.gov map, based on NCEP/NCAR Reanalysis data.
Extreme meanders
I think I’ve convinced you that it was warm in late February, but you might be wondering why? When extremes happen, it usually means that the jet stream—an area of fast-moving winds 30,000-40,000 feet in the atmosphere—got all wavy and stuck. And this east coast heatwave is no exception.
The jet stream during the third week of February was incredibly wavy. The crest of the wave was extremely far north over the eastern United States, letting warm air filter in from the south. Meanwhile, the trough of the wave across the western United States was unusually far south. This southerly dip of the jet steam meant cold air was able to filter down from Canada into the western United States (and several daily low temperature records were set as a result).
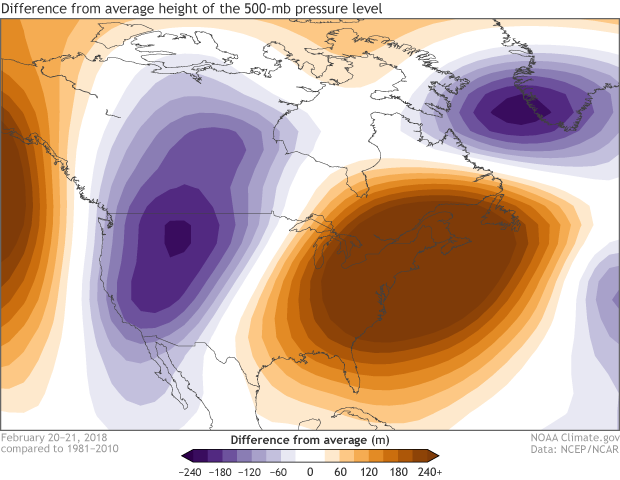
500-mb height anomalies over the United States for February 20-21, 2018. Positive height anomalies (oranges) correlate with warmer than average surface temperatures, while negative height anomalies (purples) correlate with colder than average temperatures. During the period, record-breaking warm temperatures were observed over the eastern United States. NOAA Climate.gov map, based on NCEP/NCAR Reanalysis data.
How warm was this air mass?
Very warm considering the time of year. To determine how unusually warm an air mass is, scientists can see how far up into the atmosphere certain pressure levels are reached. In warmer air masses, pressures do not fall as fast as you move up in the atmosphere as in colder air masses. This means to reach an atmospheric pressure like 500mb, it takes a farther journey up into our atmosphere. So in this event, was the height of the 500mb pressure level unusual?
You bet! The height of the 500mb pressure level was well above average across the eastern United States. In fact, weather balloons launched along the east coast measured the 500mb pressure level at record heights (with records going back to the 1940/50s) in Gray, Maine, and Brookhaven, New York all the way down to Charleston, South Carolina, and Cape Canaveral, Florida.
With the atmosphere set up this way, extremes were not a surprise.