Quick... If I say the word Florida, what images pop into your head? Palm trees, sandy beaches and, for me at least, rain and humidity. However, rains were hard to come by this winter across Florida, leading to drought that currently ranks as the largest severe drought in almost five years for the state.
In the latest update of the U.S. Drought Monitor, more than 57% of the state was currently in some degree of drought. More than 33% of the state was in severe drought. That represents the largest portion of the state in severe drought since the beginning of June 2012. And drought conditions have developed relatively rapidly as no part of the state was in severe drought as recently as only a month ago. What happened?
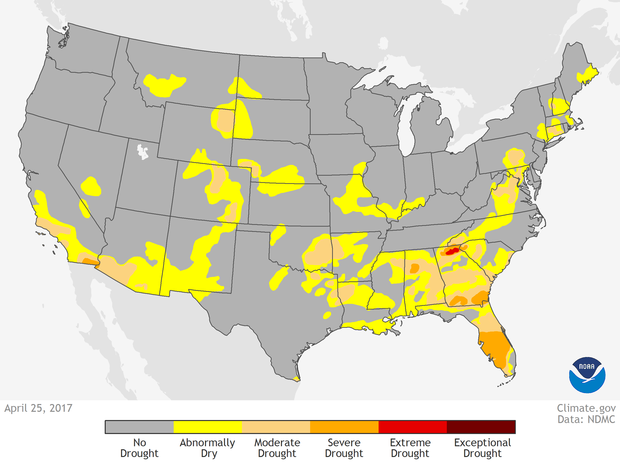
Drought conditions across the United States as of April 25, 2017. All of central Florida was experiencing severe drought (orange), and most of the remaining parts of the state were categorized as either moderate drought (peach) or abnormally dry (yellow). Climate.gov map, based on data from the National Drought Monitor project.
Where did the rain go?
The better question is what didn’t happen. And the answer is rain. Rainfall totals during the winter were much below average. From December to February, central and most of southern Florida received 75% of its normal rainfall, with the driest areas seeing just 25-50%. And those months seem wet compared to the start of spring. In March, outside of localized areas in far southern Florida, the rest of the state recorded less than 50% of its normal rainfall, and large swaths of central and northern Florida were far lower, receiving less than 25% of their usual monthly rains. In absolute numbers, the driest areas saw less than an inch of rain in March. It was the ninth driest March on record back to 1895.
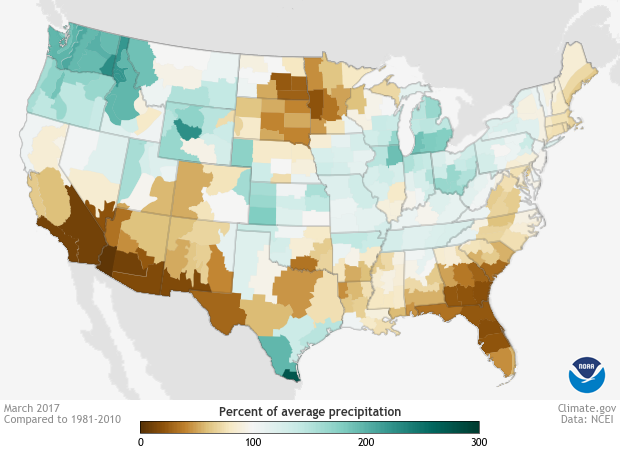
This map shows the percent of average precipitation for March 2017, compared to the 1981–2010 average, for the contiguous United States. The lowest amounts (approaching 0%) appear in shades of brown, and the highest amounts (approaching 300%) appear in shades of blue-green. Image by Climate.gov using data from NCEI.
A large lack of rainfall is one way to deteriorate ground conditions to drought levels. But extreme temperatures are another. While Florida remained relatively dry through most of the winter, it was also much warmer than normal. The 2016-2017 winter was the second warmest since 1895 for the state and March temperatures were above-average as well. Warm and dry weather were the impetus for the spreading drought.
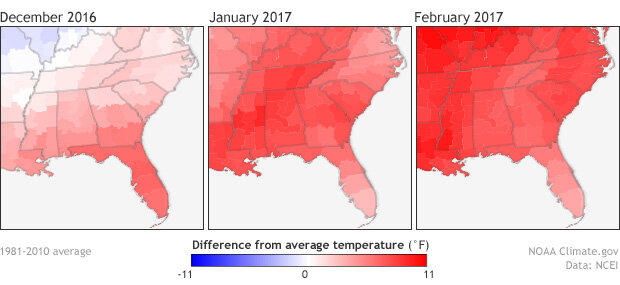
These maps show temperature anomalies for the southeastern United States, from December 2016 (left) through February 2017 (right). Temperatures above the 1981–2010 average are red, and temperatures below the 1981–2010 average are blue. Image by Climate.gov using data from NCEI.
What happened?
The winter of 2016-2017 happened to coincide with a weak La Niña pattern in the tropical Pacific Ocean. Normally during La Niña, the southern tier of the United States is left drier than average as the jet stream—area of fast moving winds high in the atmosphere that serves as a storm highway—is located farther to the north than usual. These conditions were generally seen during the winter, which is consistent with La Niña.
As for temperature, dry conditions normally correlate with warmer than average conditions as well. Combined with the warming trend due to human-caused climate change, average temperatures were on the warm side of the ledger, with nearly record breaking average winter temperatures.