In the span of a week in mid-February 2018, record-breaking snow buried Seattle, a strong storm known as a “Kona Low” pummeled the Hawaiian Islands, and a fire hose of moisture known as an “atmospheric river” soaked California. If you’re thinking the timing of those three events can’t just be a random atmospheric coincidence, then you’re right! The guiding string throughout the entire week’s weird weather was a convoluted and snake-like path of the jet stream across the central and eastern Pacific Ocean.
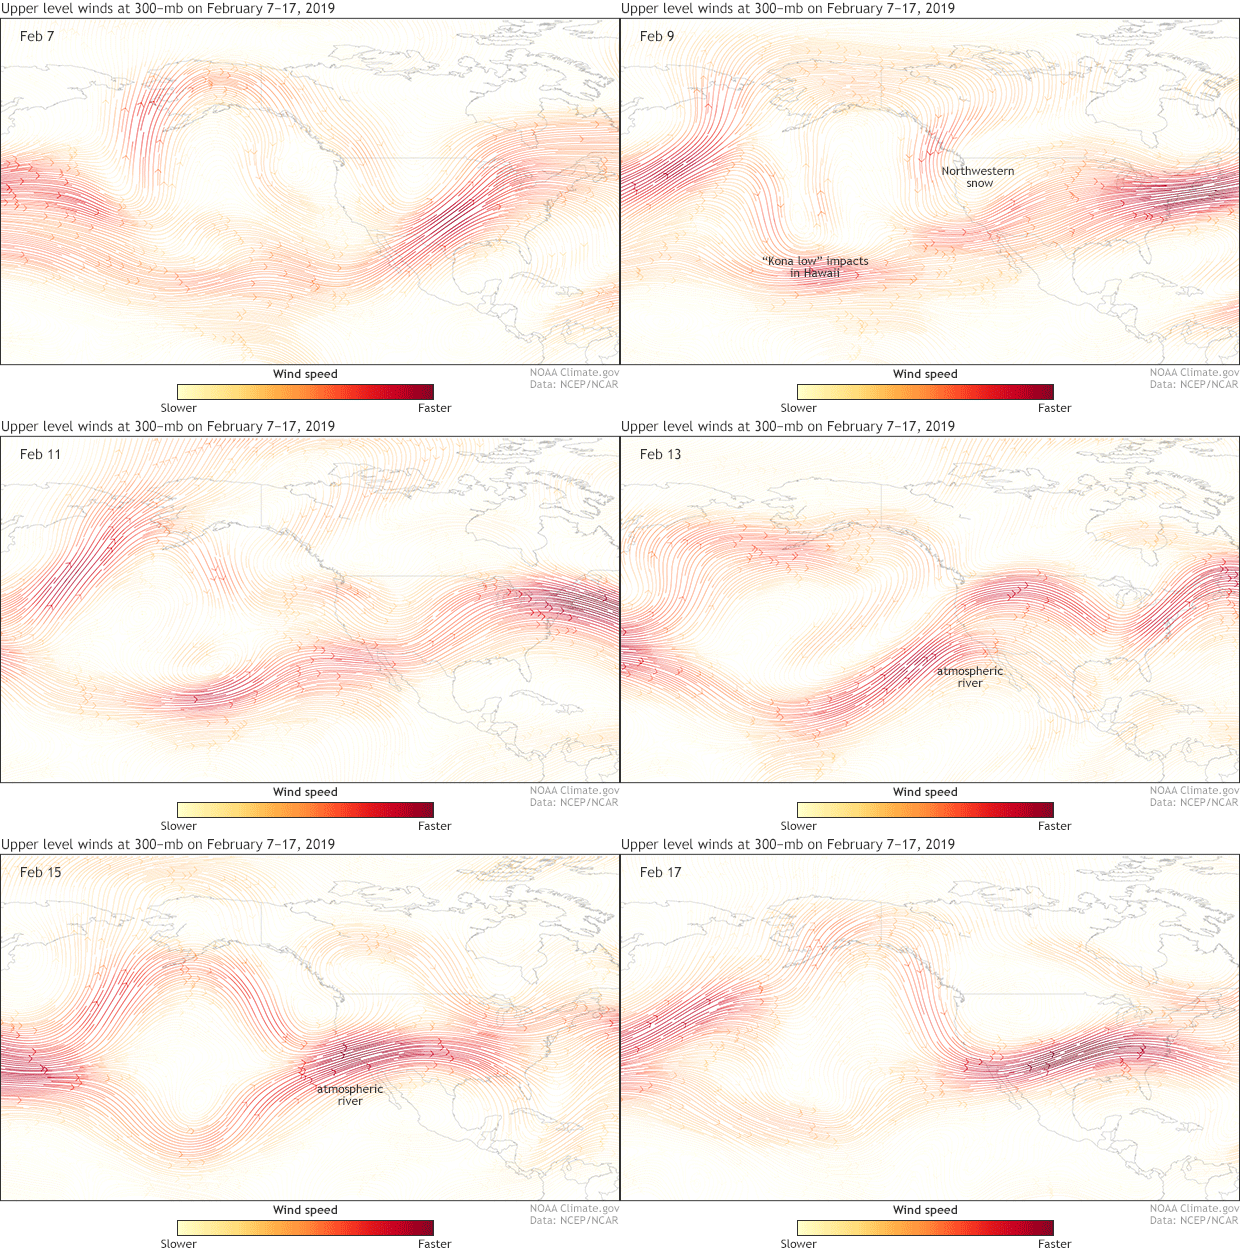
An animation of 300-mb winds across the Pacific Ocean and United States from February 7-17, 2019. The jet stream became extremely wavy over the eastern Pacific Ocean, leading to three separate extreme weather events: heavy snow in the Pacific Northwest, a strong storm which impacted Hawaii, and an atmospheric river that soaked California. NOAA Climate.gov map, based on NCEP/NCAR Reanalysis data from NOAA ESRL.
Extreme weather timeline
The three extreme events did not happen independently. Instead, they were each the result of atmospheric contortions occurring in the central and eastern Pacific Ocean. Nor were these extreme events just innocent bystanders during the others’ “crimes.” In fact, the first two extreme events—the strong storm that impacted Hawaii and the heavy snows that buried Seattle—helped to create and enhance the extremeness of the third event—the atmospheric river that inundated California. It was an extreme weather team effort in the Pacific. So let’s start at the beginning.
The Jet Stream during events #1 and #2
Leading up to the epic snows in Seattle and the storm that battered Hawaii, the jet stream—an area seven to eight miles in the atmosphere with fast moving winds that serves as a storm highway—went from blowing in a relatively straight west-to-east line to a convoluted shape. It pushed north into the Gulf of Alaska and then south along the North American coastline forming the shape of an upside down “U”.
This extreme bending occurs when there is higher air pressure than normal in the mid to upper levels of the atmosphere. The high pressure acts like a mountain in the atmosphere, forcing other air—and storms that happen to be brewing—to flow around it. From February 8-10, the atmosphere obligingly offered up several.
Along the coast of North America, in the U part of the jet stream, a series of storms dropped south out of Canada. Due to their northerly origins, the storms brought cold air and plenty of snow to the normally rainy and cool climate of coastal Washington. The result was multiple periods of moderate to heavy snowfall in places like Seattle that reached over a foot in just a few short days. From February 8-9, Seattle observed almost 8 inches of snow. By February 11, Seattle had experienced its snowiest February on record, with over 14 inches of snow.
Farther west near Hawaii, a storm—look for the narrow “U” shaped pattern of the Jet Stream—dropped south towards Hawaii. By February 9, it had strengthened into a storm known locally as a “Kona Low,” northwest of Hawaii. Its winds blew relatively cool and moisture-laden air onto the Hawaiian Islands. The resulting precipitation fell as snow across the higher elevations of the islands of Hawaii and Maui as temperatures plummeted to below freezing. The constant strong winds—which included a 191mph wind gust at the Mauna Kea Observatory high on the Island of Hawaii—caused waves north of the islands to reach 40 feet.
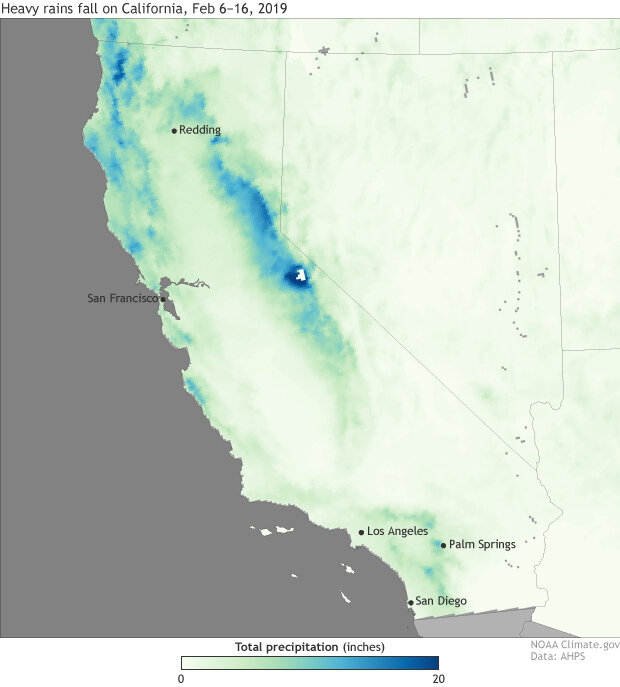
Rainfall estimates (inches) from NOAA's Advanced Hydrologic Prediction Service for February 6-16, 2019. An atmospheric river brought heavy rains and higher elevations snows across all of California. NOAA climate.gov image using data from NOAA's AHPS.
The Jet Stream and Event #3 – California’s Atmospheric River.
The counter-clockwise winds around these storms, especially the Kona Low near Hawaii, then helped to make the jet stream stronger and pointed directly at California, as seen on the animation above. At the event’s peak—February 13-15—the jet stream strengthened from near Hawaii all the way to the West Coast. This narrow region of strong winds and moisture-laden air is known as an atmospheric river. Just a few atmospheric river events can provide 30 to 50% of the annual precipitation to the West Coast.
The atmospheric river’s deep tie-in to the tropics meant that quite a lot of moist air was heading in the direction of the West Coast. In fact, measurements taken from weather balloons launched in San Diego on February 13 measured record-breaking amounts of moisture in the atmosphere, the likes of which are not normally seen until July.
The heaviest rains fell on February 13 and 14 across the entire state. In northern/central California, Redding observed over a foot of snow, the most in 50 years, and San Francisco observed over 2.5 inches of rain. Meanwhile, precipitation over the Sierra Nevada Mountains brought seasonal totals well above normal.
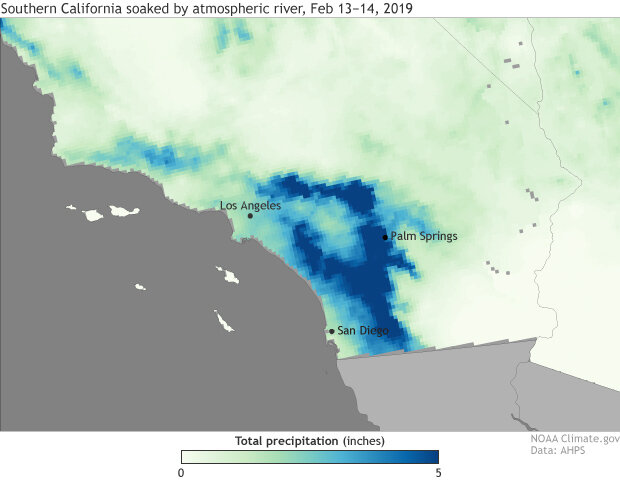
Rainfall estimates (inches) from NOAA's Advanced Hydrologic Prediction Service for February 13-14, 2019 for southern California. While an atmospheric river brought heavy rains and snows to all of California, normally dry southern California, in particular, observed an abnormally large amount of precipitation over a two-day period. NOAA climate.gov image using data from NOAA's AHPS.
Farther south the next day, southern California got slammed with gusty winds and torrential rains. Wind gusts reached nearly 70 mph in the Saint Ynez Mountains above Mission, California, while widespread rainfall totals of 1 to 4 inches were observed around Los Angeles and San Diego. Much higher amounts were observed in higher elevations around the cities. Yucaipa Ridge outside Los Angeles observed nearly 13 inches of rain during the two-day period, while Palomar Observatory saw its wettest day ever when 10.10 inches fell on Valentine’s Day.
Even the desert got in on the rainy action as 3.59 inches of rain fell in Palm Springs, a 1-in-25 year event, and the third highest all-time 24-hour rainfall amount on record for that location.
For more information on what atmospheric rivers are, how they are forecast and the damages they cause, head to NOAA’s Earth System Research Laboratory’s Atmospheric River Portal.
Final jet stream thoughts
What happened across the West Coast and eastern Pacific Ocean is a great example of how extreme weather events across thousands of miles are not just independent events but tied together in one big atmospheric machine. If it weren’t for the storms in Hawaii and the Pacific Northwest, we wouldn’t have seen such a strong atmospheric river. And if it weren’t for the jet stream becoming so abnormally wavy in the first place, Seattle and Maui probably wouldn’t have seen any snow either.


