It’s that time in winter when vacationers break out their skis and snowboards and head West to ski the slopes of the Rockies and Sierra Nevada Mountains. Economies of whole regions rely on the draw that several feet of pure, powdery snow has on people. So far this winter, not nearly enough snow has fallen.
Instead of fluffy snow, skiers are finding conditions so bad that some Colorado resorts have cut back on hours. According to the Associated Press, a resort in Grand Mesa, Colorado, has received only 45 inches of snow in total this winter, almost nine feet less than last year. As of February 14, statewide snowfall was running below average at 85% of normal.
The below-average winter is affecting mountain towns up and down the Rockies. In Utah, snow levels are currently running at only 49% of normal. The snowpack on New Year’s Day was the thinnest since 1977 according to the Salt Lake Tribune. And similar to resorts in Colorado, those in Utah have had to deal with a less than perfect ski season.
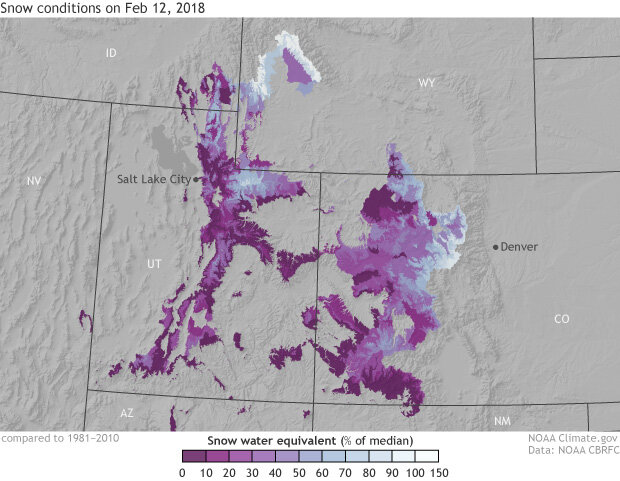
Modeled snow water equivalent values as a percentage of the 1981-2010 median on February 12, 2018 for higher elevations in the Colorado river basin across the southern Rocky Mountains. Purple colors reflect well below-normal amounts of snow water equivalent, the amount of liquid water if the snow was melted, while whiter colors reflect normal to above-normal amounts of snow. Across the Colorado river basin during the middle of February, snow amounts are well below-average in most places with broad areas having below 30% of normal snow water equivalent. Normal to above-normal snow water equivalent values are only located along the Front Range of the Rocky Mountains in Colorado and locations farther north in Wyoming. NOAA Climate.gov image using data from the Colorado Basin River Forecast Center (CBRFC).
Farther south in Arizona, snows across the Rockies and in the Upper Colorado River Basin have been extremely low so far this year. Snow water equivalents—the amount of liquid water that would result if the snow melted in an instant—are between 0 and 30% of the median for this time of year for a broad region. In fact, the “best” areas for snow this season lie along the Front Range in Colorado and are only just around normal.
Water worries
For areas in the Upper Colorado River Water Basin along the southern Rockies which rely on snow melt for water resources later in the year, snow amounts this low bring fears. Particularly, is there going to be enough snowmelt to fill Lakes Mead and Powell, which provide water to major cities like Tucson and Phoenix?
As of early February, the snowpack that feeds into the Colorado River is tied with 1990 for the lowest amount on record for this time of year. How did it get so low? It was a combination of a late start to winter across the region and warmer than average temperatures during late autumn and early winter, which not only evaporated the snowpack but during storms led to rain falling instead of snow.
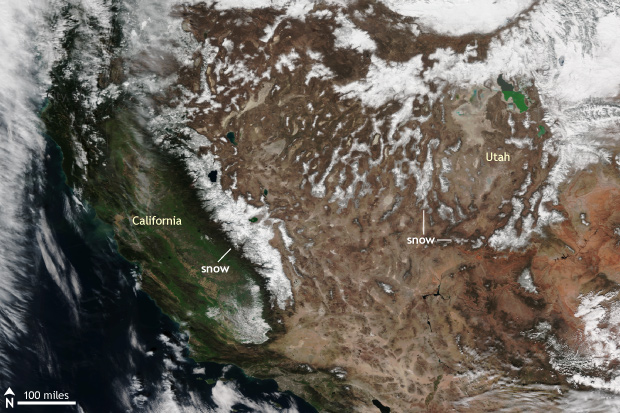
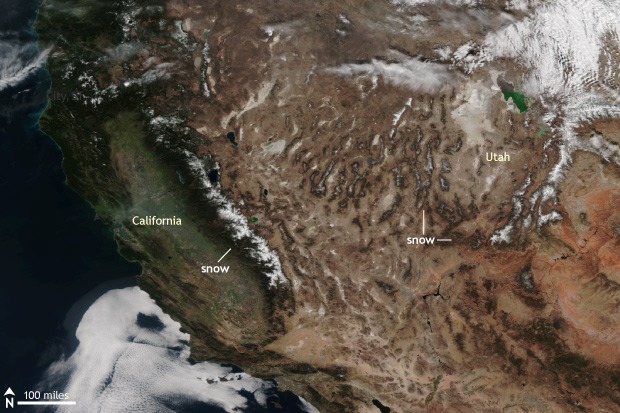
Grab and drag the slider to compare the before (left) and after (right) satellite images of the snowpack across the western United States. So far in 2018, snow levels have been below average and much lower than 2017. Suomi VIIRS satellite images from the NOAA Environmental Visualization Laboratory.
Farther west, the story is the same
Head to the Sierra Nevada Mountains in California and the story is the same. A year after a deluge and rain and snow drastically increased the snowpack in the mountains of California, hot temperatures and dry conditions have seen the same snowpack dwindle considerably.
As of the first week of February, the snow water content of the snowpack in North, Central, and Southern California was running less than 30% of normal for this time of year. Coinciding with the lack of snowpack is an overall lack of precipitation of any kind.
Precipitation amounts so far during the 2017-2018 water year in California have been meager. Across the Northern Sierra Nevadas, accumulated precipitation is below average by around 10 inches and has fallen behind even the lackluster 2014-2015 water year.
In higher elevations in the Tulare basin in southern California, precipitation totals so far are running neck and neck with the precipitation totals during the region’s driest water year on record.
After a one-year reprieve from a run of several dry wet seasons, California looks to be right back in a poor water year.
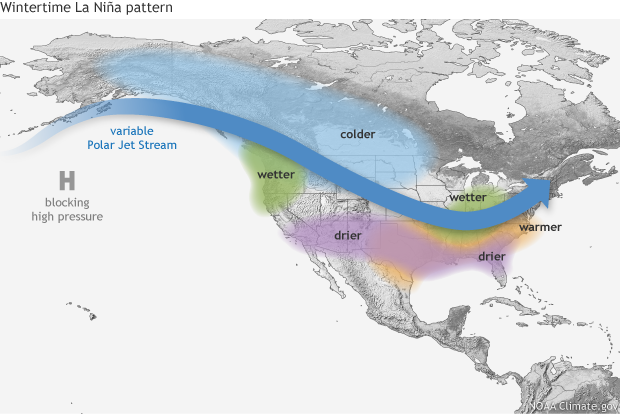
Typical impacts of La Niña on U.S. winter temperature and precipitation. Such impacts have been associated with past episodes, but all impacts aren't seen with every episode. NOAA Climate.gov drawing by Fiona Martin.
Any first guesses why this is happening?
One of the easiest connections to make whenever California and the southern Rockies are dry and warm is with La Niña. During La Niñawinters, a broad area of high pressure often sets up south of Alaska and acts like an atmospheric mountain, blocking most storm systems from reaching central/southern California and the southern Rockies. This winter has seen a weak to moderate La Nina in place over the Pacific Ocean, likely providing some influence over the winter conditions out west. It’s in fact the second La Niña winter in a row. As Nat Johnson recently discussed in our ENSO blog, history indicates that the second winter of a “double-dip” La Niña is often the drier of the two.
Of course, there is also…
Climate change
According to the National Climate Assessment, the winter snowpack over the southwestern United States has decreased over the last 50 years. Increasingly, precipitation falls as rain rather than snow, and warmer temperatures drive earlier melts in the spring/summer.
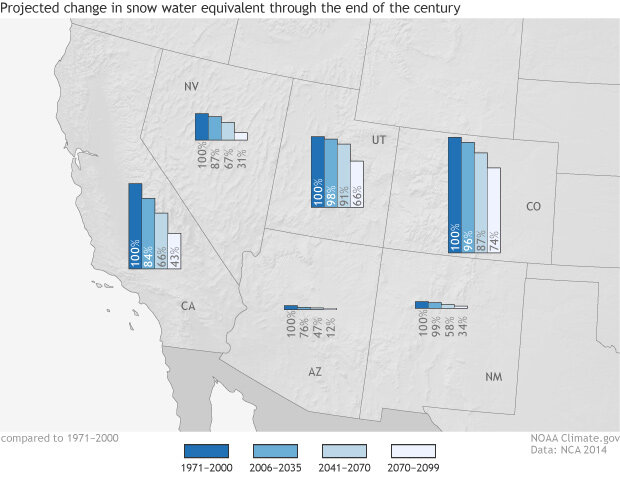
Taken from the 2014 National Climate Assessment, the projected Snow Water Equivalent for the southwestern United States for the next century as a percentage of the 1971-2000 values, assuming a continued increase in global greenhouse gas emissions (A2 scenario). The size of the bar graphs are proportional to the total amount of snow each state receives. For instance, Arizona receives far less snow than Colorado on average so Arizona's bars are proportionally smaller. Over the next century, snow levels are projected to decrease substantially across the southwestern United States. In California, for example, the snow water equivalent is projected to fall by 57% by 2070-2099 as compared to 1971-2000. Climate.gov image adapted from the 2014 National Climate Assessment figure 20.2.
As we continue to warm the planet due to emissions of greenhouse gases, mountain snowpack out west will likely continue to dwindle. Assuming we continue to increase global emissions of greenhouse gases (A2 scenario), the snow water equivalent of the snowpack in California by the end of the century will be 43% of what it was from 1971-2000. In Colorado, the snow water equivalent will be 26% less than that observed from 1971-2010.
A smaller and earlier-melting snowpack means less water to runoff into streams and tributaries in lower elevations. For places in the Sierra Nevada Mountains, Upper Colorado, and Upper Rio Grande River basins that rely heavily on a melting snowpack to provide the bulk of their annual runoff, climate change will have profound impacts on reservoir levels, water storage, and the people and ecosystems who rely on them.