2011-2012 Winter Outlook
Details
NOAA’s official Winter Outlook for 2011–2012 is unlikely to please many residents of either the still-soggy Missouri River Basin—which experienced historic flooding this past spring and summer—or the parched south-central United States, where severe to exceptional drought has been in place since spring.
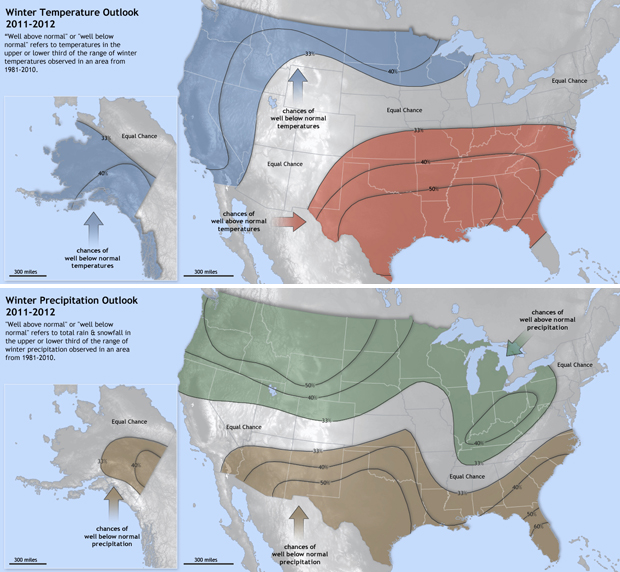
The maps at right show probabilities of well above or well below normal temperature and precipitation in the continental United States for December 2011–February 2012, according to the official forecast issued by the Climate Prediction Center in late November.
Locations that are likely to experience well above or well below normal temperatures are shaded in red or blue; precipitation forecasts are shown in shades of green (well above normal) and brown (well below normal). Places without shading indicate areas where there is an equal chance of well above, well below, or near-normal conditions.
In the case of these forecasts, “well above” or “well below” refers to temperature or precipitation in the upper or lower third of the range of climate conditions observed in an area from 1981–2010. The outlooks are more confident in some places than they are in others; black lines trace the boundaries of different levels of probability.
The Upper Missouri River Basin, including Montana, Wyoming, and the Dakotas are covered by the shades of blue and green, which indicate a greater than 33 percent chance of well below normal temperatures and well above normal precipitation—the same conditions that helped set the stage for the devastating flooding that washed over the region beginning in May 2011.
Meanwhile, the probability for well above normal temperatures and well below normal precipitation is greater than 33 percent across most of the southern half of the United States. Outside of Texas and the U.S. Southwest, a mild winter outlook might be welcome, but in those areas, it means less chance of drought relief.
Underlying the pattern of Northwest/Southeast “opposites” in this winter’s outlook is La Niña conditions in the equatorial Pacific. During La Niña episodes, the Pacific jet stream tends to meander north more frequently than normal, guiding winter storms into the northern tier of the country.
La Niña conditions take time to develop, and they generally persist for at least several seasons, so the influence on U.S. climate is relatively predictable on a seasonal basis. On shorter time scales, other—less predictable—climate patterns can cancel out or amplify the typical influence of La Niña.
Among the most influential of these “wild cards” is the Arctic Oscillation. The Arctic Oscillation is a seesawing of atmospheric pressure between the Arctic and the mid-latitudes. The pattern is always present, and it fluctuates between positive and negative phases. The negative phase of the Arctic Oscillation pushes cold air into the U.S. from Canada, causing outbreaks of cold and snowy conditions in the U.S. such as the “Snowmaggedon” storm of 2009.
Strong Arctic Oscillation episodes typically last a few weeks and are difficult to predict more than one to two weeks in advance, so the patterns doesn’t factor in to the Climate Prediction Center’s seasonal (3-month) outlooks. Whether the Arctic Oscillation will favor the negative phase, as it has the past two winters, remains to be seen.
Related Videos