2017 State of the climate: Atmospheric carbon dioxide
Details
Carbon dioxide is the most important of the long-lived greenhouse gases responsible for Earth’s natural greenhouse effect. Without greenhouse gases, Earth’s average surface temperature would be near 0°F instead of close to 60°F. Since the start of the Industrial Revolution in the mid-1700s, global carbon dioxide amounts have risen more than 45 percent. That additional carbon dioxide has warmed the planet and made the oceans more acidic.
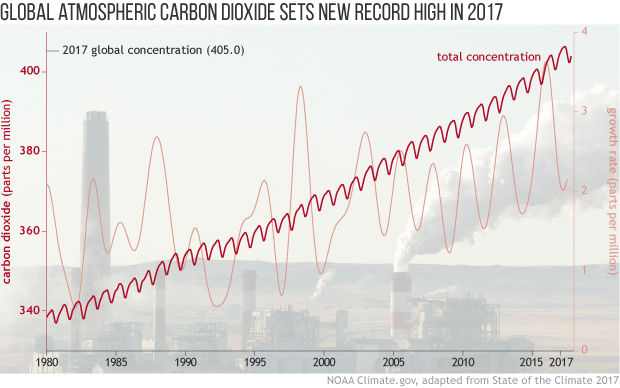
Adapted from the American Meteorological Society’s State of the Climate in 2017, this graph shows monthly average carbon dioxide amounts for 1980–2017 (red line) along with the yearly average rate of change (pink line). Observations come from NOAA’s global observing network.
Preliminary results for 2017 indicate global atmospheric carbon dioxide was 405.0 ± 0.1 ppm, a new record high. Between 2016 and 2017, global annual mean carbon dioxide increased 2.2 ± 0.1 ppm. In 2015 and 2016, atmospheric carbon dioxide increased by 3.0 ppm per year, boosted in part by El Niño conditions that peaked in late 2015. In the 1960s, the global growth rate of atmospheric carbon dioxide was roughly 0.6 ± 0.1 ppm per year. Over the past decade, however, the growth rate has been closer to 2.3 ppm per year.
To determine the amount of atmospheric carbon dioxide prior to the start of the modern record, scientists rely on ice cores from Greenland and Antarctica. Air samples from these cores indicate that carbon dioxide was roughly 278 ppm in 1750, about the time the Industrial Revolution started. Since then, carbon dioxide in the atmosphere has increased 45.7 percent, primarily due to burning of coal, gas, and oil for energy. Additional amounts of carbon dioxide from human activities have been absorbed by the ocean.
For Earth’s temperature to remain steady, the number of watts of incoming sunlight must match the number of watts of outgoing thermal energy (heat) radiated to space by the Earth’s land surface, oceans, and atmosphere. As of 2017, long-lived greenhouse gases were creating a global energy imbalance of roughly 3 Watts per square meter—3 more watts of incoming sunlight than outgoing heat for every square meter of surface area. Carbon dioxide was responsible for about two-thirds of that imbalance.
Graph is adapted from Figure 2.45a in State of the Climate in 2017. It is overlaid on a photo of Dave Johnson Power Plant in Wyoming by Greg Goebel, used under a Creative Commons license.
References
Dlugokencky, E.J., Hall, B.D., Montzka, S.A., Dutton, G., Mühle, J., Elkins, J.W. (2018). Atmospheric composition [in State of the Climate in 2017]. Bulletin of the American Meteorological Society, 99(8), S46–S49.
Global Greenhouse Gas Reference Network. Mauna Loa. Accessed July 11, 2018.