Arctic Air Ushers in Chilly December
Details
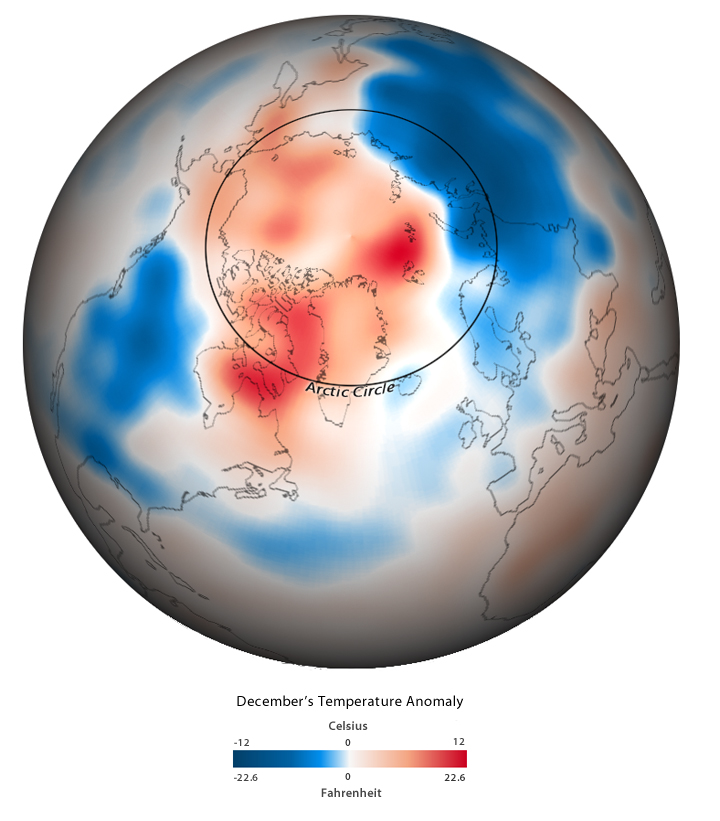
A wave of cold Arctic air gripped much of North America, Europe, and northern portions of Asia through the month of December 2009. Compared to average temperatures for December (measured from 1971 to 2000), conditions in December 2009 were cooler in the regions shown in blue and warmer in the regions shown in red.
The cold snap is related to a phenomenon climate scientists call the Arctic Oscillation. Air pressure conditions oscillate between two common patterns in the Arctic and surrounding regions. In the positive phase of the oscillation, lower-than-average pressure over the Arctic and higher-than-average pressure over the surrounding region tend to keep cold, polar air within the polar region. When conditions flip to the negative phase of the oscillation, air pressure is higher than average over the Arctic and lower than average over the surrounding regions. This situation allows cold, dense air from the Arctic to push southward from the polar region to locations in the middle latitudes.
Pressure conditions in December showed the Arctic Oscillation in a strong negative phase, and the image shows corresponding conditions for temperature. Note that much of the Arctic region was warmer than average in December: the cold snap doesn’t represent a decrease in Earth’s overall temperature, only a temporary redistribution of heat energy related to climate variability.
To view December’s temperature anomalies, Michelle L’Heureux, a climate scientist at NOAA’s Climate Prediction Center, compiled data records from NOAA’s Climate Data Assimilation System. This system combines temperature records from ground stations with mathematical descriptions of Earth’s atmosphere to produce a standard representation of temperatures where air pressure would be equivalent to sea level. This standard allows meteorologists and climate scientists to compare temperatures at different locations based on the overall energy in the Earth system rather than differences that result from factors such as the elevation of individual ground stations.