Arctic sea ice: 2012 record low was 18% smaller than previous record, nearly 50 percent below average
Details
On August 26, 2012, Arctic sea ice extent shrank to 1.58 million square miles (4.1 million square kilometers), an area about half the size of the Lower 48 United States. That ice was melting was not news; after all, the Arctic ice pack undergoes an annual cycle of winter expansion and summer melting. The “news” was that the extent had broken the previous record low, set in summer 2007, and there were still several more weeks to go in the melt season.
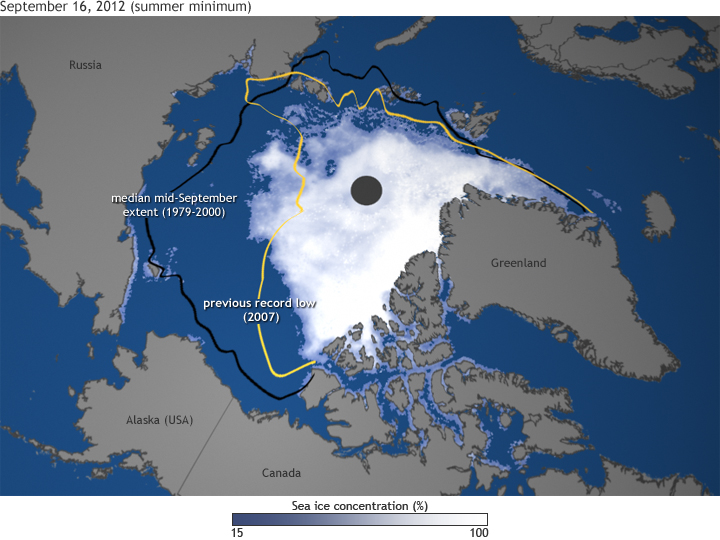
By the time the summer melt season came to an end in mid-September, the ice extent had shrunk down to just 1.3 million square miles (3.41 square kilometers), setting a new record low that was 18 percent smaller than the previous record and nearly 50 percent smaller than the long-term (1979-2000) average. This map shows ice concentration on September 16, along with the extent of the previous record low (yellow line) and the mid-September median extent (black line).
It can be hard to imagine how radical a transformation the loss of so much ice is. Most of us live in a world where snow and ice are transient things, momentarily hiding the “real” landscape. In the Arctic, ice is the real landscape, and for it to have shrunk to half its historic summer extent is as much a transformation of the environment as if half the forests of New England had been replaced by Saguaro cactus.
The transformation from icy to ice-free has ecological consequences and physical ones. The loss of sea ice directly affects polar bears, seals, walruses, and many birds, for which the sea ice is a raft, a place to haul out, rest, feed, and give birth. The “where, when, and what kind” of blooms of phytoplankton—the foundation of the marine food web—is changing, and those changes cascade through fish populations.
The most profound physical impact ice loss is that the loss becomes a sort of “self-fulfilling prophecy.” Less ice turns Arctic latitudes from a bright white solar reflector into a dark expanse of open water: a black t-shirt on a summer day. The more ice that melts, the more sunlight the ocean absorbs. The more sunlight the ocean absorbs, the warmer it gets, and the more ice melts.
That self-reinforcing feedback loop is the heart of the process that scientists refer to as “Arctic amplification” of global warming, and it explains why temperatures have risen faster in the Arctic than they have at temperate latitudes.
More information on Arctic Sea ice can be found in Chapter 2 of the 2012 Arctic Report Card.
Map based on sea ice concentration data from the National Snow and Ice Data Center.