Climate Conditions: April 2013 Rain & Snow
Details
In Brief
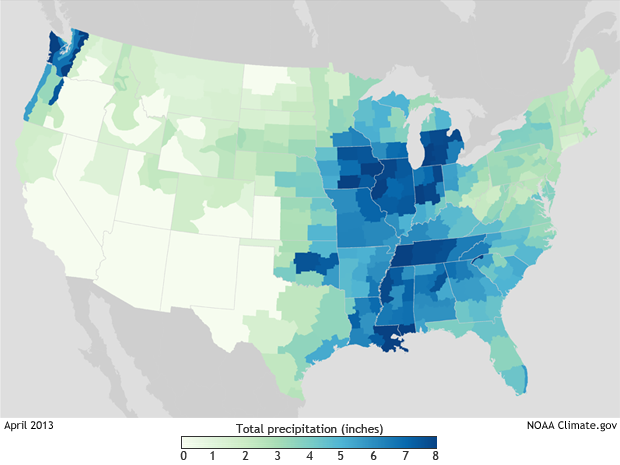
This map shows how much rain and snow fell across the contiguous United States during April 2013. Each block of color shows the total precipitation in that area for the month: the darker the color, the higher the total precipitation. The map shows how much precipitation fell, but it does not indicate if amounts were higher or lower than usual.
More Info
Measurements used to generate the map come from automated and volunteer-operated weather stations across each climate division. The values are the average of all precipitation totals reported by official stations within each Climate Division.
In common use, the term precipitation refers to all types of liquid and solid water that fall from clouds. Types of precipitation include rain, snow, hail, sleet, freezing rain, snow pellets, and graupel. For this map, precipitation is defined more precisely: values indicate the total depth of liquid water that fell across each area.
Variations in the water content of frozen precipitation—from relatively dry "powder" snow at one end of the spectrum to wet slush with the consistency of mashed potatoes at the other end—mean that it has to be melted before it is measured. Thus, the precipitation in an area that had a foot or more (12+ inches) of fluffy snow on the ground during the month would be less than the snow depth because the actual amount of liquid water in all that snow is less than a foot.
These climate statistics and many others are part of NOAA’s National Monthly Climate Report. The National Climatic Data Center produces these reports as part of the suite of climate services that NOAA provides government, business, and community leaders to help them make informed decisions.
