Data Snapshots: July 2013 Precipitation
Details
In Brief
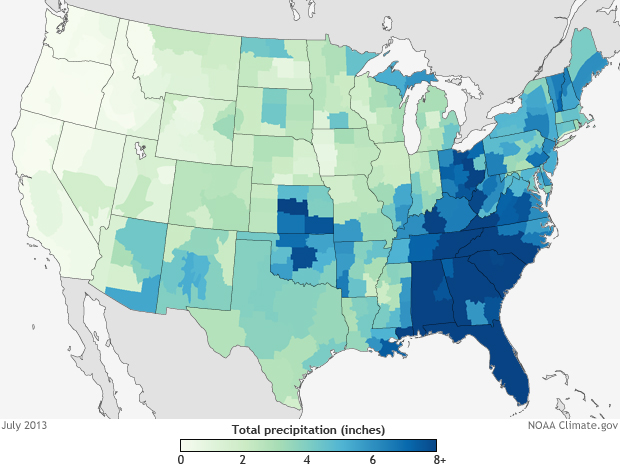
This map shows how much rain fell across the contiguous United States during July 2013. Colors indicate the amount of rain that fell on each area through the month: the darker the color, the higher the total precipitation. Note that the map shows how much rain fell, but it does not indicate if the amounts were higher or lower than usual.
Measurements used to generate this map come from automated and volunteer-operated weather stations. Colors represent the average of all precipitation totals reported by official stations within each climate division. Staff at NOAA's National Climatic Data Center compile these values and release them as part of their monthly National Overview of climate.
More Information
During July, the Pacific Northwest was uncharacteristically dry while the Southeast was drenched by record and near-record amounts of rain. Florida had its wettest July on record, and 14 other states received enough rain to put them in the top ten wettest years of the 119-year record. Though the map shows all areas that received eight inches or more in the same dark blue, some locations received more than double that amount. Overall, the contiguous U.S. experienced its 5th wettest July on record.
You can explore additional climate statistics for locations in the contiguous United States through maps, graphs, and other information prepared by the National Climatic Data Center. These tools are part of the suite of climate services that NOAA provides government, business, and community leaders to help them make informed decisions.
