Data Snapshots: June 2014 Difference from Average Temperature
Details
In Brief
Hot on the heels of a new record set in May, average global temperature also reached a record high in June 2014. According to the latest analysis from the National Climatic Data Center, average temperature for Earth's surface was 1.30°F above the twentieth-century average, edging out June 1998 by 0.05°F to become the hottest June on record. Nine of the ten warmest Junes since 1880 have occurred during the twenty-first century, including each of the past five years.
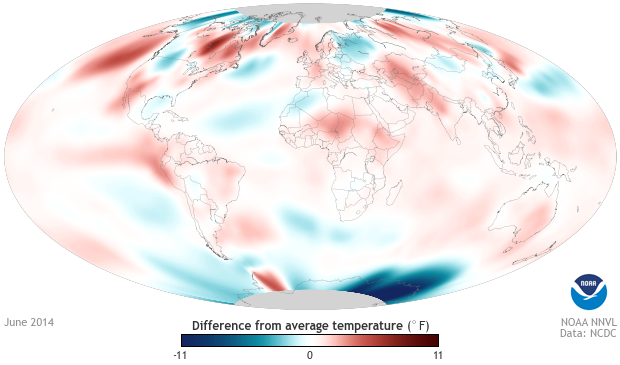
The map at right shows how surface temperatures in June 2014 compared to average June temperatures from 1981-2010. Darkest blue shows temperatures 11 or more degrees Fahrenheit cooler than average; darkest red shows temperatures 11 or more degrees warmer than average. White and light areas show where temperatures were close to their long-term average.
More Info
Global average sea surface temperature for June was record warm, at 1.15°F above the twentieth-century average of 61.5°F. This temperature surpassed the previous all-time record for any month by 0.09°F. Similar to May, scattered sections across every major ocean basin were record warm. As illustrated by the map, large parts of the western equatorial and northeastern Pacific Ocean and nearly all of the Indian Ocean were much warmer than average for the month. Although neither El Niño nor La Niña conditions were present during June 2014, sea surface temperatures across the central and eastern equatorial Pacific Ocean region continued to trend above average. NOAA's Climate Prediction Center estimates a 70 percent chance that El Niño conditions will develop during Northern Hemisphere summer and an 80 percent chance it will develop during the fall and winter.
Caption adapted from the State of the Climate June 2014 Global Analysis report. Map based on GHCN data originally provided by the National Climatic Data Center (NCDC) and interpolated by the NOAA Environmental Visualization Lab.