Data Snapshots: Sea Surface Temperature on August 19, 2014
Details
In brief
More than halfway through August, the Atlantic Ocean has seen just two named storms, and NOAA’s Atlantic Hurricane Season Outlook has been updated to indicate a 70% chance for a below-normal season. Meanwhile, the Eastern Pacific Ocean—which has been flirting with El Niño conditions for several months—has already spawned 12 tropical storms.
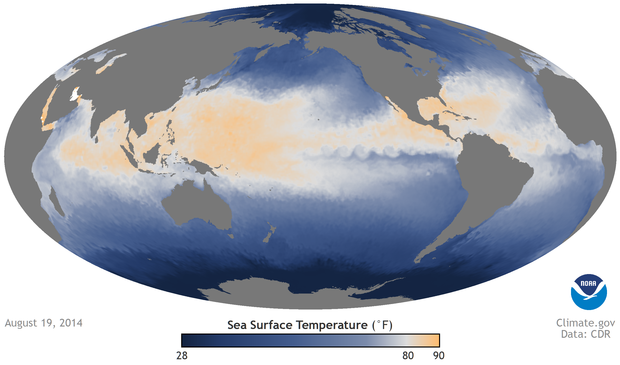
As shown in the sea surface temperature image at right, both the Atlantic and Pacific ocean basins have areas where surface temperature are above 80°F—high enough to provide energy for tropical storms—but atmospheric conditions have not been favorable for storm development in the Atlantic. The unfavorable atmospheric conditions include strong vertical wind shear, relatively dry air, and a weak West African Monsoon, all of which suppress formation of tropical storms and hurricanes. These conditions are predicted to persist through October.
More Information
Colors on this map show the temperature of water at the ocean’s surface. The darkest blue shows the coldest water. Progressively lighter shades of blue show increasingly warmer water, up to 80°F. White and orange areas are above 80°F. While heat is mixed and stored throughout the depth of the ocean, it is the temperature at its surface—where the ocean is in direct contact with the atmosphere—that plays a significant role in weather and short-term climate.
The map was generated using a combination of satellite measurements, readings taken by ships and buoys, and maps of sea ice concentration. To produce the daily map, a computer algorithm merges the observations from all three sources.
The operational NOAA product represented by the map is Daily 1/4° Optimum Interpolated Sea Surface Temperature. The National Climatic Data Center's Climate Data Records Program offers access to these and other climate data records as part of their effort to provide trustworthy information on how, where, and to what extent Earth’s land, oceans, atmosphere, and ice sheets are changing.