Extreme heat increases pregnant women’s risk of pre-term delivery
Details
Babies who arrive early have a higher risk of negative—sometimes tragic—outcomes, from death to developmental delays that can last through childhood. States in the U.S. Southeast have the highest rates of premature deliveries in the country, and researchers are still far from being able to explain all the factors that contribute to the heightened risk mothers in the region face. In North Carolina, however, one of those factors is extreme heat.
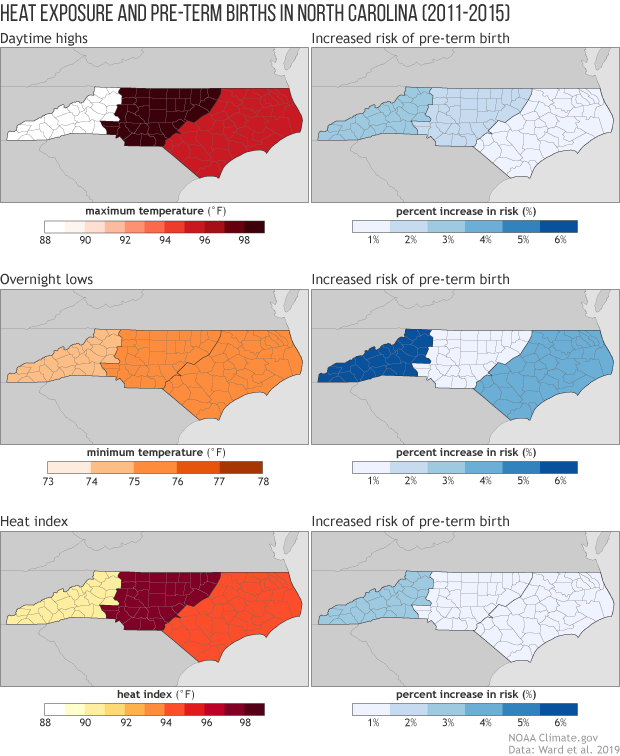
Based on data from 2011–2015, these maps show the relationship between temperatures across North Carolina—daytime highs (top), overnight lows (middle), and average heat index (bottom)—and a woman’s increased risk of delivery before 37 weeks of pregnancy. For each of these indicators of heat, rising temperatures were associated with higher risk in each of the state’s geographic regions (Mountains, Piedmont, and Coastal Plain). The temperatures on the maps are the threshold at which the odds of pre-term birth began to increase exponentially, indicating extreme risk.
One of the most important patterns that the researchers uncovered is that extreme heat at night (minimum temperature) generally posed a greater hazard than extreme heat in the day (either maximum temperature or average heat index). In the Mountains counties, the risk of a woman experiencing premature labor jumped by 6 percent when overnight low temperatures reached the range of 74-75°Fahrenheit, with exponentially increasing risk for every further 2° increase in temperature. In the Piedmont and across the Coastal Plains counties, the temperature threshold was slightly higher than in the Mountains, 75°-76°F, but the increase in risk was smaller in the Piedmont (1%) than the Coastal Plains (4%).
Extreme heat is an annual hazard across Southeast, posing risks not just to pregnant women, but also to older adults, children, and outdoor workers. It’s a risk that is projected to increase significantly in the coming century unless we reduce human-produced greenhouse gas emissions. The researchers hope that insights from this study can be combined with information on the frequency of exposure to such heat events in different parts of the state to help public health officials and others develop locally tailored strategies for better protecting pregnant women from the impacts of excessive heat.
This research was funded by NOAA’s Climate Program Office through its Carolinas Regional Integrated Sciences and Assessments team (CISA), one of 11 such teams that NOAA sponsors across the country to help connect people with climate science and services specifically relevant to their region’s economy, communities, and infrastructure.
References
Ward, A., Clark, J., McLeod, J., Woodul, R., Moser, H., & Konrad, C. (2019). The impact of heat exposure on reduced gestational age in pregnant women in North Carolina, 2011–2015. International Journal of Biometeorology. https://doi.org/10.1007/s00484-019-01773-3