Global impacts of El Niño and La Niña

| File Name | Resolution | File Size | View | Download |
|---|---|---|---|---|
|
Nino_winterandsummer_620.jpg
|
620 × 613
|
154.7 KB
|
||
|
Nina_winterandsummer_620.jpg
|
620 × 660
|
109.5 KB
|
||
|
ElNinoDJF.jpg
|
1800 × 782
|
478.4 KB
|
||
|
ElNinoJJA.jpg
|
1800 × 782
|
449.4 KB
|
||
|
LaNinaDJF.jpg
|
1800 × 782
|
462.2 KB
|
||
|
LaNinaJJA.jpg
|
1800 × 782
|
463.8 KB
|
||
|
Nina_globalimpacts_620.jpg
|
620 × 351
|
61.1 KB
|
||
|
el-nino-la-nina-winter-global-impacts-stacked-1800px.png
|
1800 × 1800
|
1,280.3 KB
|
Details
El Niño and La Niña are the opposite phases of ENSO (pronounced en-so), which is short for El Niño-Southern Oscillation. Operating in the tropical Pacific Ocean, ENSO is Earth's singlest most influential natural climate pattern.
El Niño and La Niña alternately warm and cool large areas of the tropical Pacific—the world’s largest ocean—which significantly influences where and how much it rains there. The primary location of moist, rising air (over the basin’s warmest water) is centered over the central or eastern Pacific during El Niño and over Indonesia and the western Pacific during La Niña.
Like a boulder in a stream, this relocation disrupts the atmospheric circulation patterns that connect the tropics with the middle latitudes, which in turn modifies the mid-latitude jet streams. By modifying the jet streams, ENSO can affect temperature and precipitation across the United States and other parts of the world.
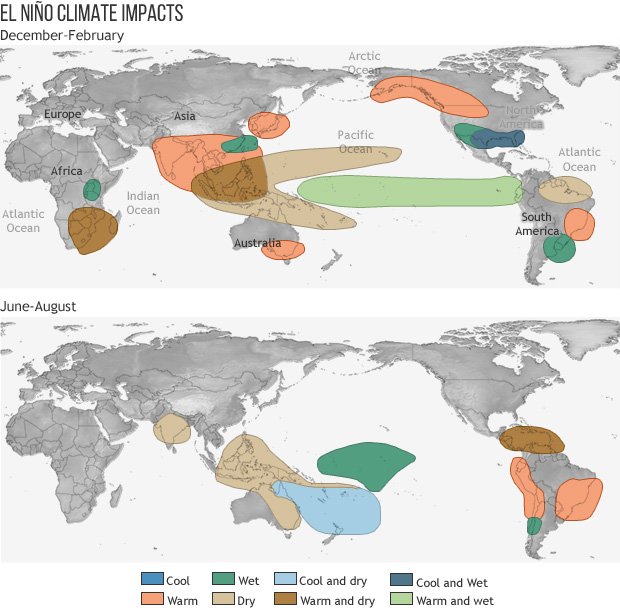
The maps at right show how El Niño commonly affects Northern Hemisphere winter and summer climate patterns around the globe. Notice that there are no consistent impacts on North America during the summer months, while areas around the tropics and Southern Hemisphere subtropics (Australia, for example) experience impacts in both seasons.
Below and to the right of the main image in this post is a list of links to the La Niña version of this graphic, as well as large versions of each individual map. All images are free for re-use. Please credit NOAA Climate.gov.