Influence of global warming on U.S. heat waves may be felt first in the West and Great Lakes regions
Details
On average, more people in the United States die each year from heat-related illness than any other weather disaster, according to the National Climate Assessment. Human-caused global warming will increase the danger as heat waves become hotter, longer, and more frequent. According to new NOAA research, communities in the U.S. West and the Great Lakes region will have the least time to prepare.
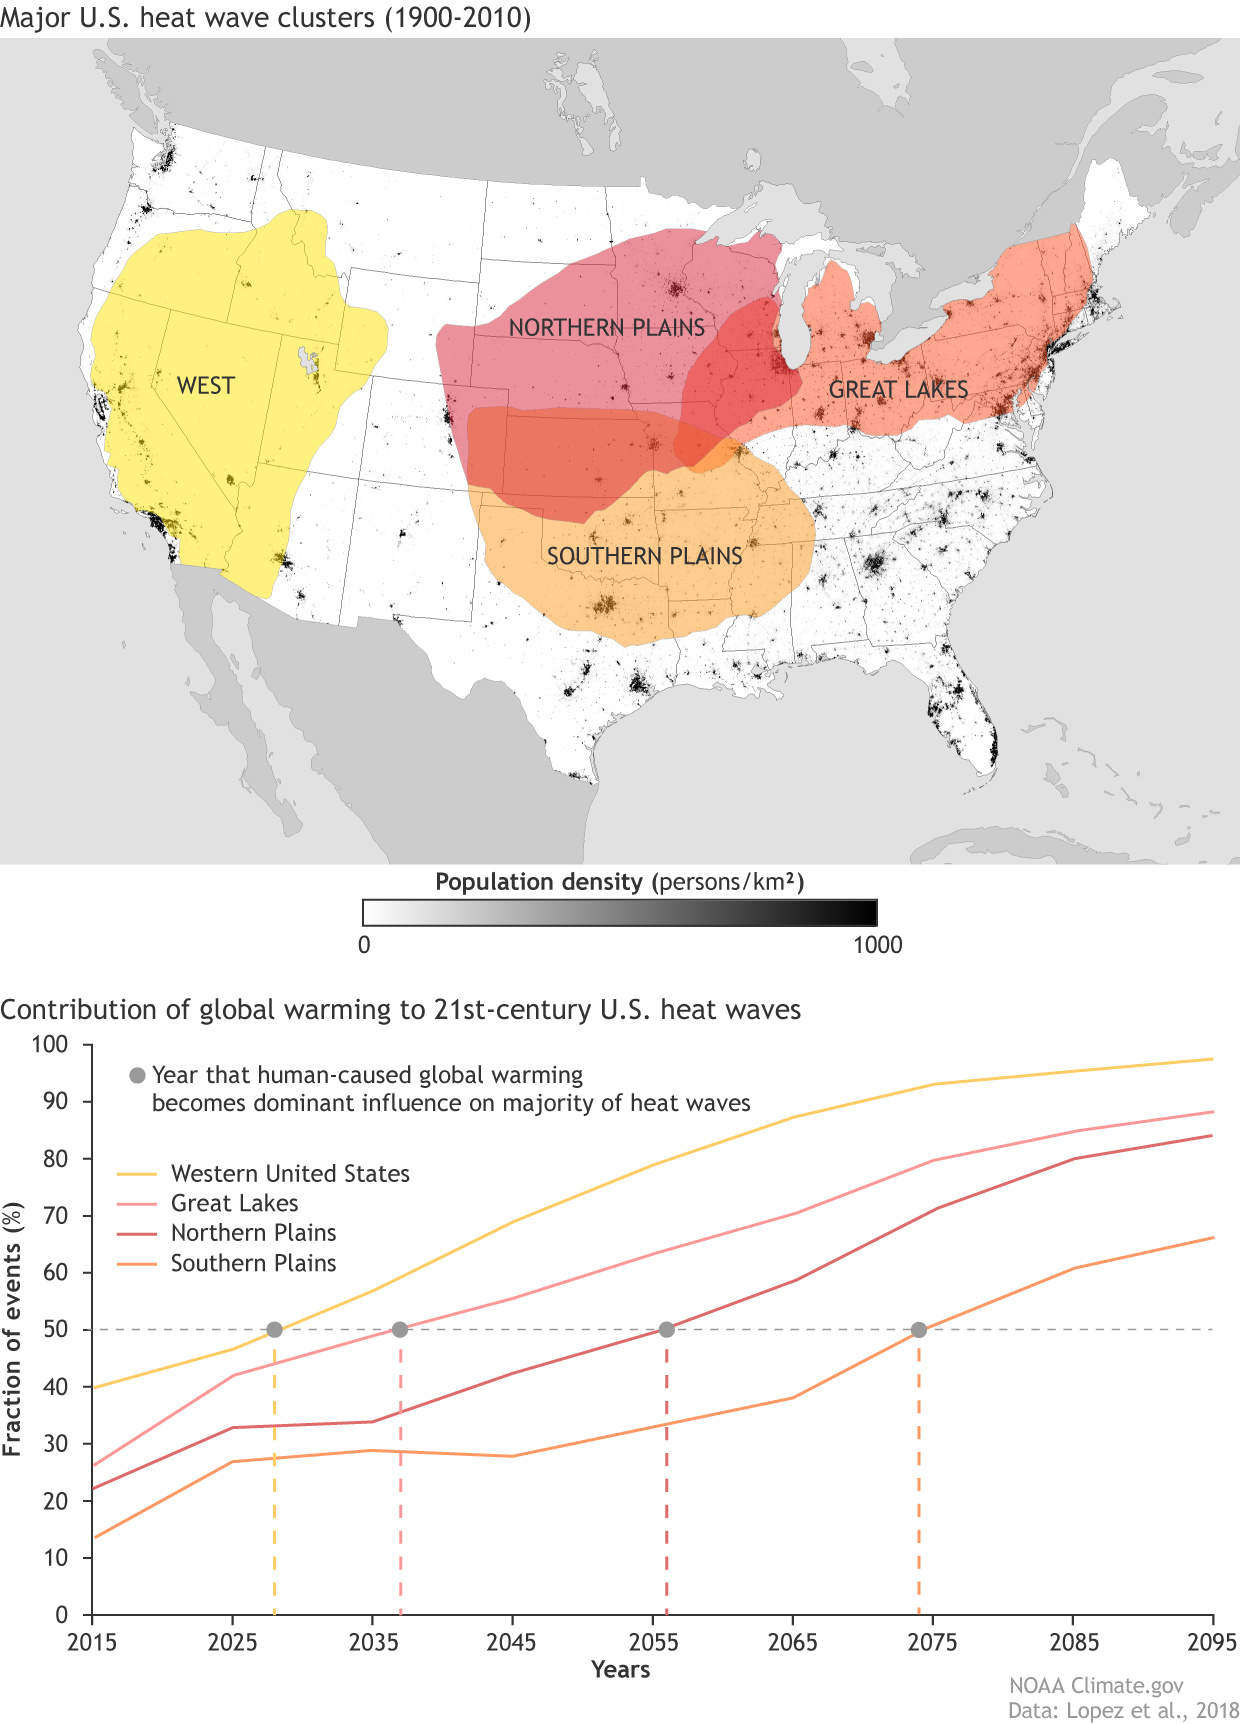
The image at right shows where and when global warming due to excess greenhouse gases may overtake natural variability as the main driver of heat waves in different parts of the country. The map (top) shows population density along with the location of four major heat wave “clusters”—large geographic areas that tended to experience extreme heat at the same time during the past century. “Extreme heat” was defined as daily mean temperature in the top 5% of the location’s historical record.
The graph shows the fraction of heat waves for which models projected global warming would be the primary contributor. The projections were based on a “business as usual” scenario that assumes global energy demand will continue to be met with fossil fuels. The dots mark the year when models projected global warming would become the primary contributor to more than half the region’s heat waves.
Global warming emerged as the primary driver of more than half of Western U.S. heat waves by the end of the 2020s. In the Great Lakes region, more than half of all heat waves would be predominantly due to global warming by the mid-2030s. The Great Plains were slower to reach that threshold. The delay may be due to projected increases in moisture flow into the region from the Gulf of Mexico and a cooling influence from the increased precipitation and soil moisture.
The dates identified in this analysis reflect the point at which models project the signal of global warming will be clearly distinguishable from the noise of natural variability. This doesn’t mean that global warming is having no influence on U.S. heat waves now. It just means that for the time being, natural variability is the primary contributor to heat waves more often than global warming is.
This research was led by Hosmay Lopez of NOAA’s Atlantic Oceanographic and Meteorological Laboratory, and it was supported in part by NOAA’s Climate Program Office. NOAA supports research like this to help American communities, businesses, and public health providers understand our vulnerabilities and to identify opportunities for us to adapt and prepare for extreme weather and the impacts of global warming. People across the country are taking steps to build resilience. You can read about some of these efforts on our sister site, the U.S. Climate Resilience Toolkit.
References
Lopez, H., West, R., Dong, S., Goni, G., Kirtman, B., Lee, S.-K., & Atlas, R. (2018). Early emergence of anthropogenically forced heat waves in the western United States and Great Lakes. Nature Climate Change, 1. https://doi.org/10.1038/s41558-018-0116-y
Heat-related links
Explore U.S. maps showing current and future numbers of days with extreme heat
Browse maps of future U.S. monthly temperatures by decade
Visit the National Integrated Heat Health Information System website