Nature’s archives: piecing together 12,000 years of Earth’s climate story
Details
Much like archaeologists dig up artifacts to piece together stories of ancient civilizations, climate scientists dig up natural “artifacts” to piece together stories of past climates. From fossil pollen to air bubbles trapped in ice cores, these artifacts, or “proxies,” allow scientists to compare current climate change to the past. This week, NOAA released the most comprehensive database ever assembled of proxies—many available publicly for the first time—that can tell scientists about temperatures since the last ice age ended roughly 12,000 years ago.
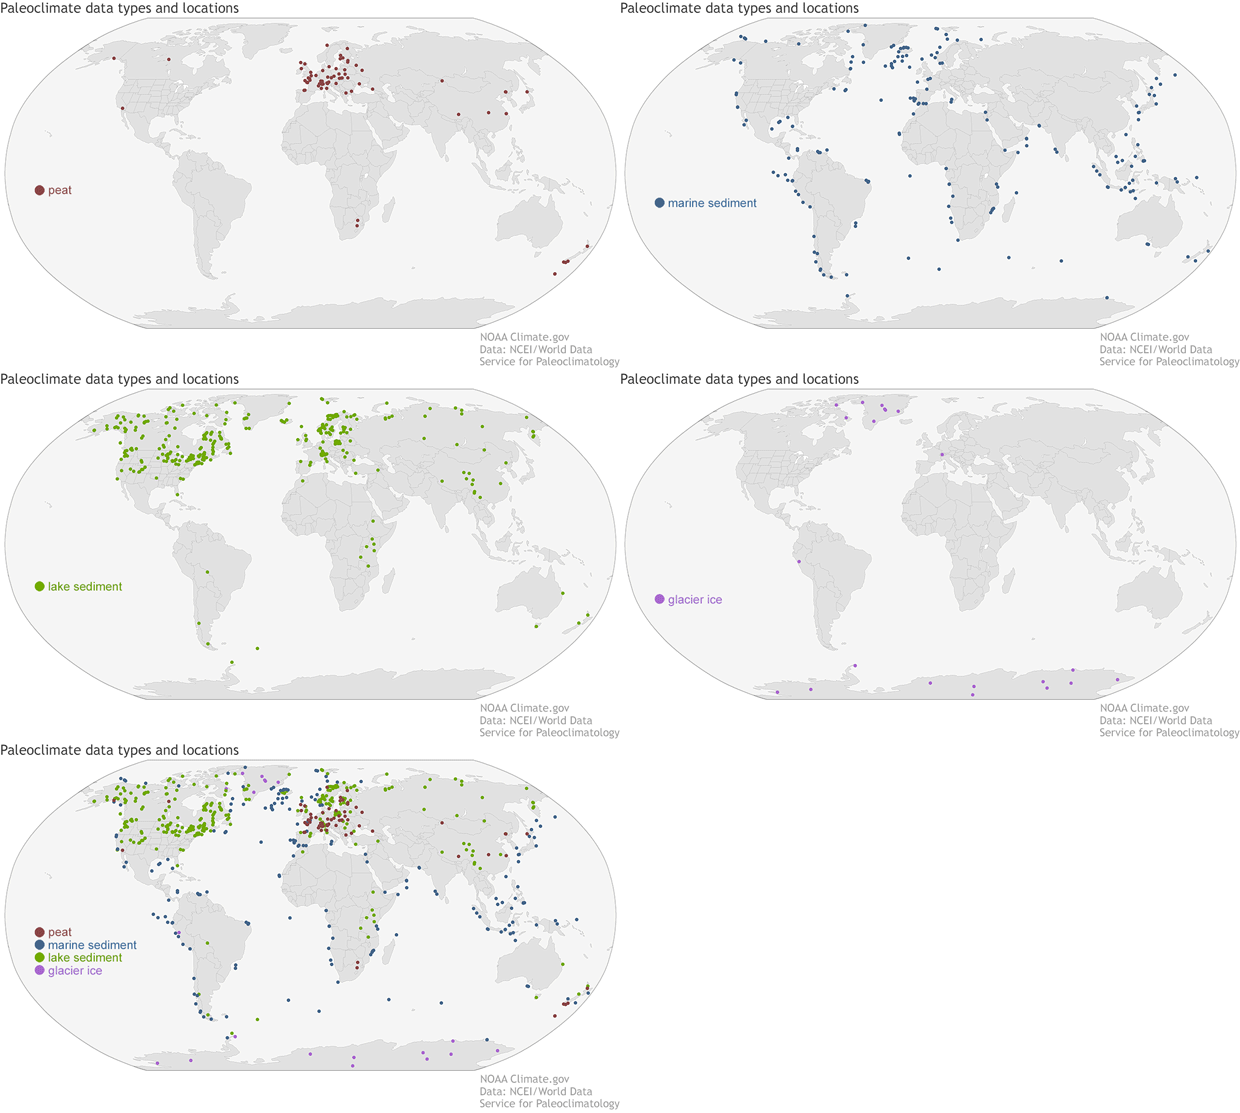
This animation shows the types of paleoclimate proxies in the database and the 684 sites they came from. Before ending with a map of all the sites, the animation cycles through four maps of the different material from which the proxy came: peat (maroon), partially decayed plant material found in marshy or damp regions; marine sediment (blue), lake sediment (green), and glacier ice (purple).
Paleoclimate proxies indirectly record climate and atmospheric conditions present when they formed or grew; air bubbles in ice cores sample past carbon dioxide levels, pollen and undecayed plant matter reveal growing conditions, and the ratio of oxygen isotopes in marine fossils indicate ocean temperatures. Proxies can come from all over the world — from glaciers in Antarctica to the tropical oceans — and compiling them into datasets can help place today’s warming climate into the context of a longer history.
Lake sediment sites represent the majority of the data in the new database (50%), while glacier ice sites represent the smallest component (3%). Over half of the sites (51%) are located between 30-60°N, covering the United States, Europe, the Middle East, Central China, Japan, Canada, and Russia, and 16% are in the Southern Hemisphere. Locations and categories with more sites typically reflect a combination of logistical reasons. For instance, lakes are located in more regions than glaciers and, according to the research team, are easier and less expensive to sample. In addition, since land is unevenly distributed between Earth’s hemispheres, there are more lake sites and researchers to collect data in the Northern Hemisphere compared to the Southern Hemisphere.
By using records from multiple proxy sources, the scientists were able to cover every continent and ocean for a more complete reconstruction of Earth’s climate over the past 12,000 years. In addition, comparing multiple proxy sources against each other allows scientists to reconstruct a more reliable and consistent story.
“These records will help us determine if current warming has exceeded the range of temperature changes throughout the last 12,000 years,” said Carrie Morrill, study co-author and research scientist with the University of Colorado Boulder and NOAA’s National Centers for Environmental Information.
And, though our climate today is likely warming more rapidly than it has in the past, studying warm periods captured in the database might point out other consequences of global warming to help society plan for the future.
This new database will continue to be updated with new records as they are made available through more research and improved data collection and analysis techniques. It results from a partnership between NOAA’s World Data Service for Paleoclimatology, the Cooperative Institute for Research in Environmental Sciences, and a large team of international researchers led by scientists at the University of Northern Arizona, with funding contributions from NOAA Climate Program Office’s Climate Observations and Monitoring Program, the U.S. and Swiss National Science Foundations, the Heising-Simons Foundation, and the Past Global Changes (PAGES) Project.
