NOAA-sponsored research shows that mobile sensors are a low-cost, effective way for U.S. cities to map their carbon dioxide emissions
Details
More than a dozen U.S. states, close to 150 cities, and more than a thousand U.S. businesses have adopted plans to dramatically reduce their planet-warming carbon dioxide emissions. That means cities across the country are asking the same question: what’s the cheapest way to map and measure carbon dioxide emissions? New NOAA-funded research led by Derek Mallia, Logan Mitchell, and John Lin from the University of Utah demonstrated the usefulness of one approach. The team found that deploying mobile sensors on an electrified light rail train, instead of installing stationary sensors, can drastically improve cities’ understanding of their carbon dioxide emissions.
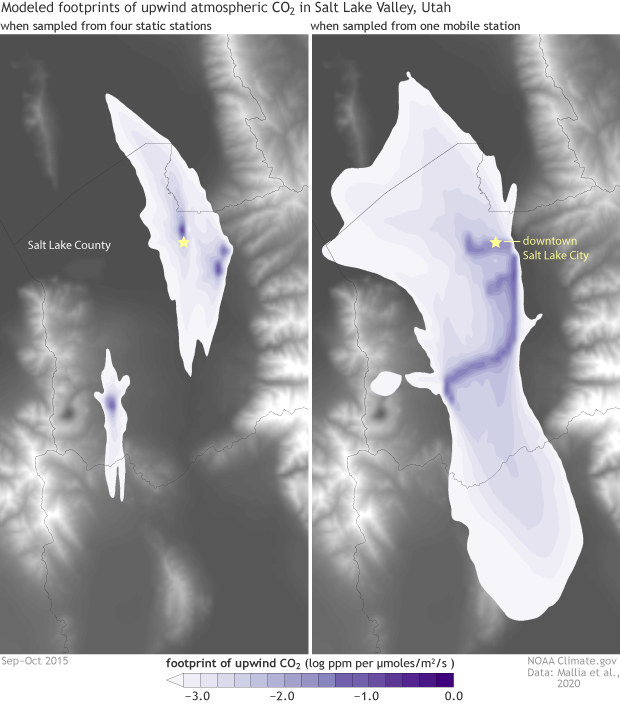
In the past, tradition has called for deploying multiple research-grade, costly sensors in different parts of the city. But the first pair of maps illustrates the expanded upwind sampling area, or footprint, that can be mapped by a single carbon dioxide instrument mounted on a light rail train car (right side), compared to the upwind footprint for four stationary instruments at fixed locations (left). Mobile sensors attached to a light rail train car allowed researchers greater insight into the Salt Lake Valley region, including important carbon dioxide sources such as Interstates 15 and 80, downtown Salt Lake City, power plants, and oil refineries. Not only did mobile sensors produce better results than stationary sensors, but they did so at a fraction of the cost. The authors estimate that a single sensor deployed on a light rail public transit platform could gather the same information on carbon dioxide emissions as 30 stationary sensors, saving the city $1.2 million dollars.
Creating urban emission inventories like Salt Lake City’s requires a multitude of data streams to be blended in a model. Each data set has its own source of uncertainty. For example, researchers can measure the emissions from the tail pipe of a car, but to estimate emissions from all cars in a city requires knowing (1) how many cars are in a city, (2) knowing when and where these cars are being driven, (3) the age of the vehicle fleet, (4) the types of vehicles, and more. Ideally, real-world observations allow researchers to place upper or lower limits on what they don’t know. The maps show that mobile sensors significantly reduced the uncertainty in model estimates of the city’s emissions—cutting it in half in some places in the Salt Lake Valley.
The Salt Lake Valley’s natural boundaries around Salt Lake City make it ideal for studying urban carbon emissions, and analogous urban areas exist. The only condition for selecting a light rail system is that the trains must be electrical and run above ground; otherwise, the train’s own emissions could skew the results. For instance, future studies could examine Denver, Colorado, another urban region with public light rail. Future research could also apply this study framework to air pollutants such as PM2.5—the tiny soot and aerosol particles that are especially dangerous to human health. The research might also encourage cities without light rail to seriously consider other options for mobile sensor deployment.
This research was funded by NOAA’s Climate Program Office through its Atmospheric Chemistry, Carbon Cycle, and Climate (AC4) program.