  • Home
  • News & Features
  • Maps & Data
  • Teaching Climate
  • About
  • Contact
  • FAQs
  • Site Map
  • What's New?
  • El Niño & La Niña

Climate news, stories, images, & video (ClimateWatch Magazine)

  • News
  • How the Climate System Works
  • Climate Change & Global Warming
  • Natural Climate Patterns
  • Climate Impacts
  • Observing & Predicting
  • Policy & Planning
  • Extreme Events
  • Home
  • News & Features
  • Images & Video
  • Past Three Decades Warmest on Record

Past Three Decades Warmest on Record

Author: 
Rebecca Lindsey
September 3, 2010

blank.jpg

Image Credit: 
Climate.gov Team
Alternate Versions: 

large 1850s map

Image icon large 1850s map

large 1860s map

Image icon large 1860s map

hadcrut3_anom_1870.jpg

Image icon hadcrut3_anom_1870.jpg

hadcrut3_anom_1880.jpg

Image icon hadcrut3_anom_1880.jpg

hadcrut3_anom_1890.jpg

Image icon hadcrut3_anom_1890.jpg

hadcrut3_anom_1900.jpg

Image icon hadcrut3_anom_1900.jpg

hadcrut3_anom_1910.jpg

Image icon hadcrut3_anom_1910.jpg

hadcrut3_anom_1920.jpg

Image icon hadcrut3_anom_1920.jpg

hadcrut3_anom_1930.jpg

Image icon hadcrut3_anom_1930.jpg

hadcrut3_anom_1940.jpg

Image icon hadcrut3_anom_1940.jpg

hadcrut3_anom_1950.jpg

Image icon hadcrut3_anom_1950.jpg

hadcrut3_anom_1960.jpg

Image icon hadcrut3_anom_1960.jpg

hadcrut3_anom_1970.jpg

Image icon hadcrut3_anom_1970.jpg

hadcrut3_anom_1980.jpg

Image icon hadcrut3_anom_1980.jpg

hadcrut3_anom_1990.jpg

Image icon hadcrut3_anom_1990.jpg

hadcrut3_anom_2000.jpg

Image icon hadcrut3_anom_2000.jpg
Share This: 
Topics: 
Greenhouse Effect
Atmospheric Circulation
Carbon Cycle
Causes of Climate Change
Greenhouse Gas Emissions
Measuring and Modeling Climate
Climate Data
Measurements and Observations
Global Climate Modeling
Category: 
How the Climate System Works
Climate Change & Global Warming
Observing & Predicting
Department: 
Images & Video

Fossil fuels contain the carbon drawn out of the atmosphere by land and ocean plants over millions of years. More than a century ago, Earth scientists speculated that burning those fuels—returning that huge pool of carbon to the air so rapidly—would warm the climate.

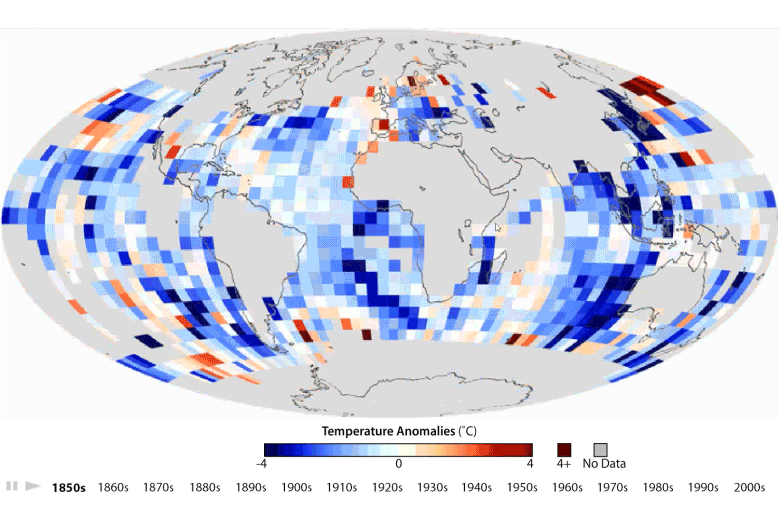
In the past few decades, the evidence that those century-old speculations were true has become unmistakable. The maps above show where temperatures each decade from 1850-2000 were above (red) or below (blue) the 1961-1990 average. Places with no data are colored gray.

Averaging temperature anomalies over time spans of decades or longer is a better way to understand how climate is changing than comparing individual years. That's because even with global warming from greenhouse gases, natural climate patterns or events (such as El Niño cycles or massive volcanic eruptions) are the main reason why any individual year is warmer or cooler than another.

The most obvious trend revealed by these maps is the shift to the warm (red) end of the color scale in recent decades. In the earlier maps in the series, regional-scale warm anomalies come and go from one decade to the next—what you would expect from natural climate variability. Toward the end of the series, however, the warmer-than-average conditions become more widespread, persistent, and intense—what you would expect from human-caused global warming.

In the State of the Climate in 2009 report, an international team of climate scientists concluded, "Each of the last three decades was warmer than all earlier decades in the instrumental record and each set a new and statistically significant record, culminating in the 2000s, which was the warmest decade of all."

Maps based on surface temperature data from the Climate Research Unit at the University of East Anglia.

You Might Like

Nature’s archives: piecing together 12,000 years of Earth’s climate story

April 15, 2020

Great Lakes ice cover decreasing over last 40 years

July 9, 2018

Heavy downpours more intense, frequent in a warmer world

March 4, 2014

Sochi among the warmest Winter Olympics host cities

February 10, 2014

climate.gov

  • Home
  • News & Features
  • Maps & Data
  • Teaching Climate
  • About
  • Contact
  • FAQs
  • Site Map
  • What's New?

Follow Climate.gov

Follow us on twitter
Follow us on Facebook
Follow us on Instagram

Subscription link to sign up for Climate.gov's weekly update newsletter

2014 Webby Award winning website

Webby Award Webby Award

Click each award to learn more

  • Information Quality
  • NOAA Freedom of Information Act
  • Privacy Policy
  • Disclaimer
  • USA.gov
  • ready.gov