Plants as drought detectors in the U.S. Great Plains
Details
A plant is a sophisticated climate-observing device. It's a thermometer, a rain gauge, and a light detector all rolled into one. You can tell a lot about the climate of an area just by looking at its plants.
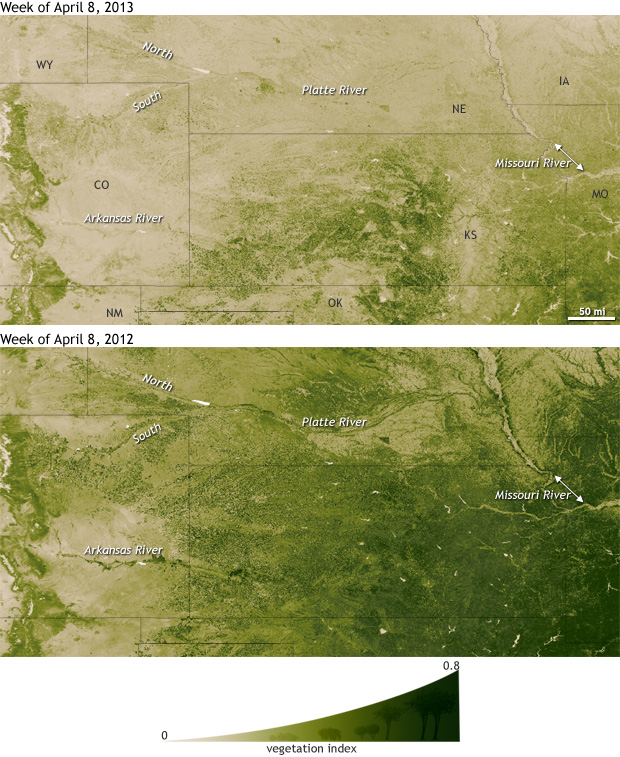
Take this satellite-based view of the High Plains during the week of April 8, 2013 (top) and 2012 (bottom). Based on new maps of vegetation greenness from the Suomi NPP satellite, the images show that plants in the region—the heart of the U.S. winter wheat croplands—"measured" dramatically different climate conditions this spring than they did last year.
These satellite images are not exactly like a photo. They are digital images that combine visible and near-infrared wavelengths of light to make green vegetation stand out from other land surfaces. The darker the green, the leafier the vegetation.
The difference in greenness between the images is likely due to a combination of the drought that has expanded across the High Plains since last spring and the fact that spring 2012 (especially March) was unusually warm, while spring 2013 was unusually cool.
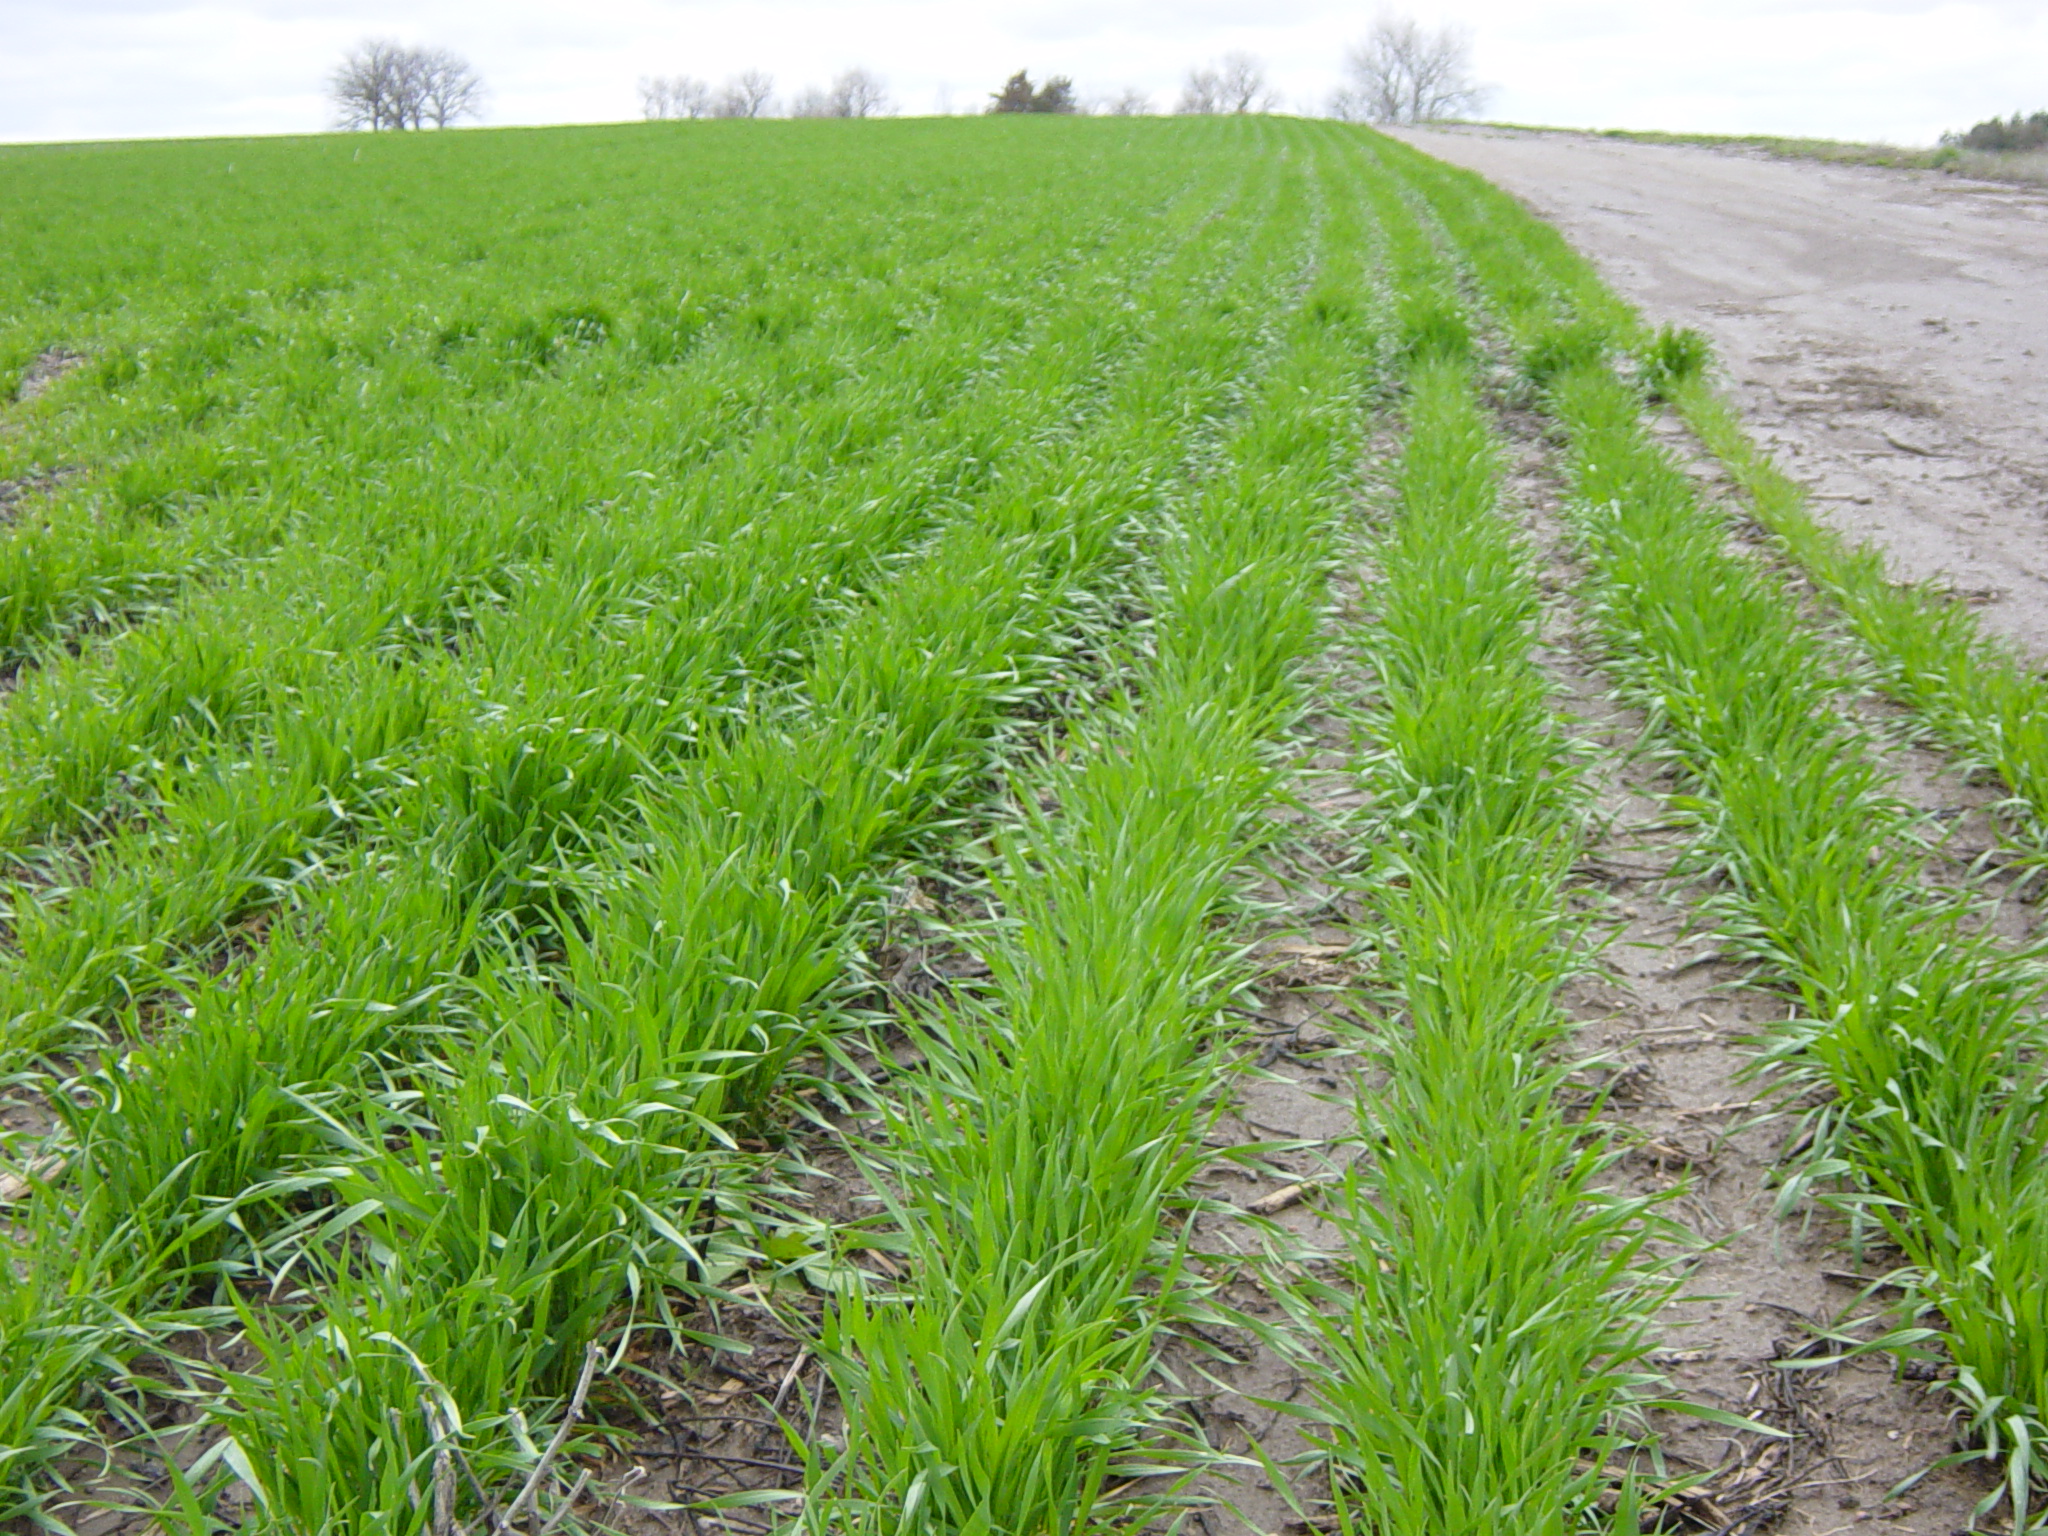
In early April, most of the greenness across southern Nebraska, Colorado, Kansas, Oklahoma, and the northern Texas panhandle would be due to the winter wheat crop. The wheat is planted in early fall. Harvest begins in June.
In early April 2012, only the southeast corner of Colorado and small areas of the Texas and Oklahoma panhandles were experiencing drought, so the major wheat areas between the Platte and Arkansas Rivers had good growing conditions. and the landscape was quite green. By early April of 2013, however, virtually all of Nebraska, eastern Colorado, and Kansas were in extreme or exceptional drought. Between the dryness and the cold, the winter wheat crop was small, and the landscape was shades of tan and pale green.
The differences between the images tell an important story, but the similarities also reveal something about the regional climate. Both images green-up from west to east. That gradient in greenness hints at the average annual precipitation across this part of the country. The Great Plains are "downwind" of the Rocky Mountains, which grab most of the rain and snow from weather systems crossing the country from the Pacific to the Atlantic. The Plains get enough moisture to grow prairie grasses and other small plants, but not many trees. Farther east, out of the rain shadow of the Rockies, the images are darker green. Moisture from the Gulf of Mexico and the Atlantic Ocean boosts annual rainfall, and the prairie starts to transition to woods.
Editor's note: During the week of April 8, a major snow storm passed through the Great Plains. The area shown in these images did not have snow on the ground, but many areas to the north (and in the Rockies)—which are shown in the large versions of the maps—did. A thick enough blanket of snow could reduce the vegetation greenness to nearly 0.
Images by Dan Pisut, NOAA Environmental Visualization Lab, based on NASA/NOAA Suomi NPP satellite data. Interpretation by Brad Rippey, U.S. Department of Agriculture, and Rich Tinker, NOAA Climate Prediction Center.
Links:
Drought map animation: November 2011-December 2012