Projecting Climate Conditions for the End of the Century
Details
Global climate models project that near the end of the 21st century, average surface temperature over most of Earth’s surface will be several degrees warmer than today, mainly due to rising levels of greenhouse gases in the atmosphere. The actual amount of warming will largely depend on how many humans are on the planet, how much energy they use, and the sources of their energy.
For example, if Earth supports a population of nine billion humans in 2100, and coal and oil are their primary sources of energy, we can expect different climate conditions than if population levels off at seven billion and people get most of their energy from carbon-neutral sources such as nuclear or wind power.
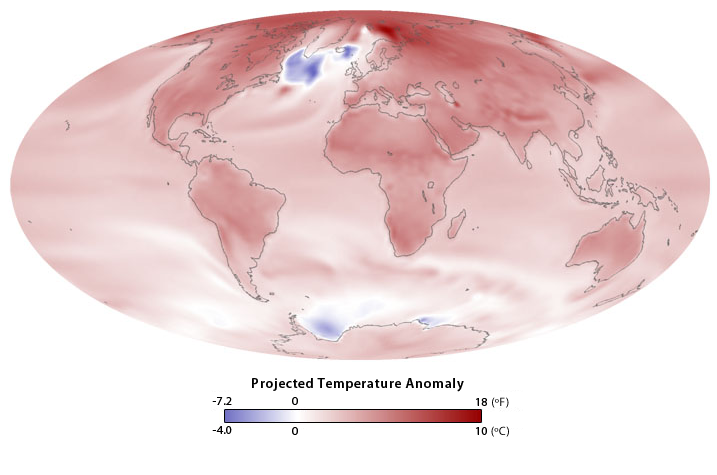
The image at right shows projected change in average surface temperature for a possible future named Scenario A1b. In this possible future, global population peaks mid-century, per person energy use is very high, and energy use is balanced across fossil fuel sources such as coal and oil and alternative energy sources such as nuclear and wind power. According to this scenario, greenhouse gas emissions will continue increasing until around 2050, then begin to decrease. For its 2007 report, the Intergovernmental Panel on Climate Change used projections for a range of defined scenarios, each associated with a specific level of greenhouse gases.
The map above shows temperature anomalies, or differences from average conditions, measured over 30 years. Colors on the map depict projected change in average surface temperature for 2071-2100 compared to 1971-2000, calculated by a global climate model at NOAA’s Geophysical Fluid Dynamics Laboratory. Areas shown in red tones on the map are projected to warm, and areas shown in blue are projected to cool. The intensity of the color at each location indicates the projected amount of warming or cooling, with white indicating no change.
References
IPCC Special Report on Emissions Scenarios
NOAA ClimateWatch image by Ned Gardiner using data from the NOAA Geophysical Fluid Dynamics Laboratory’s CM2.1 Model.
