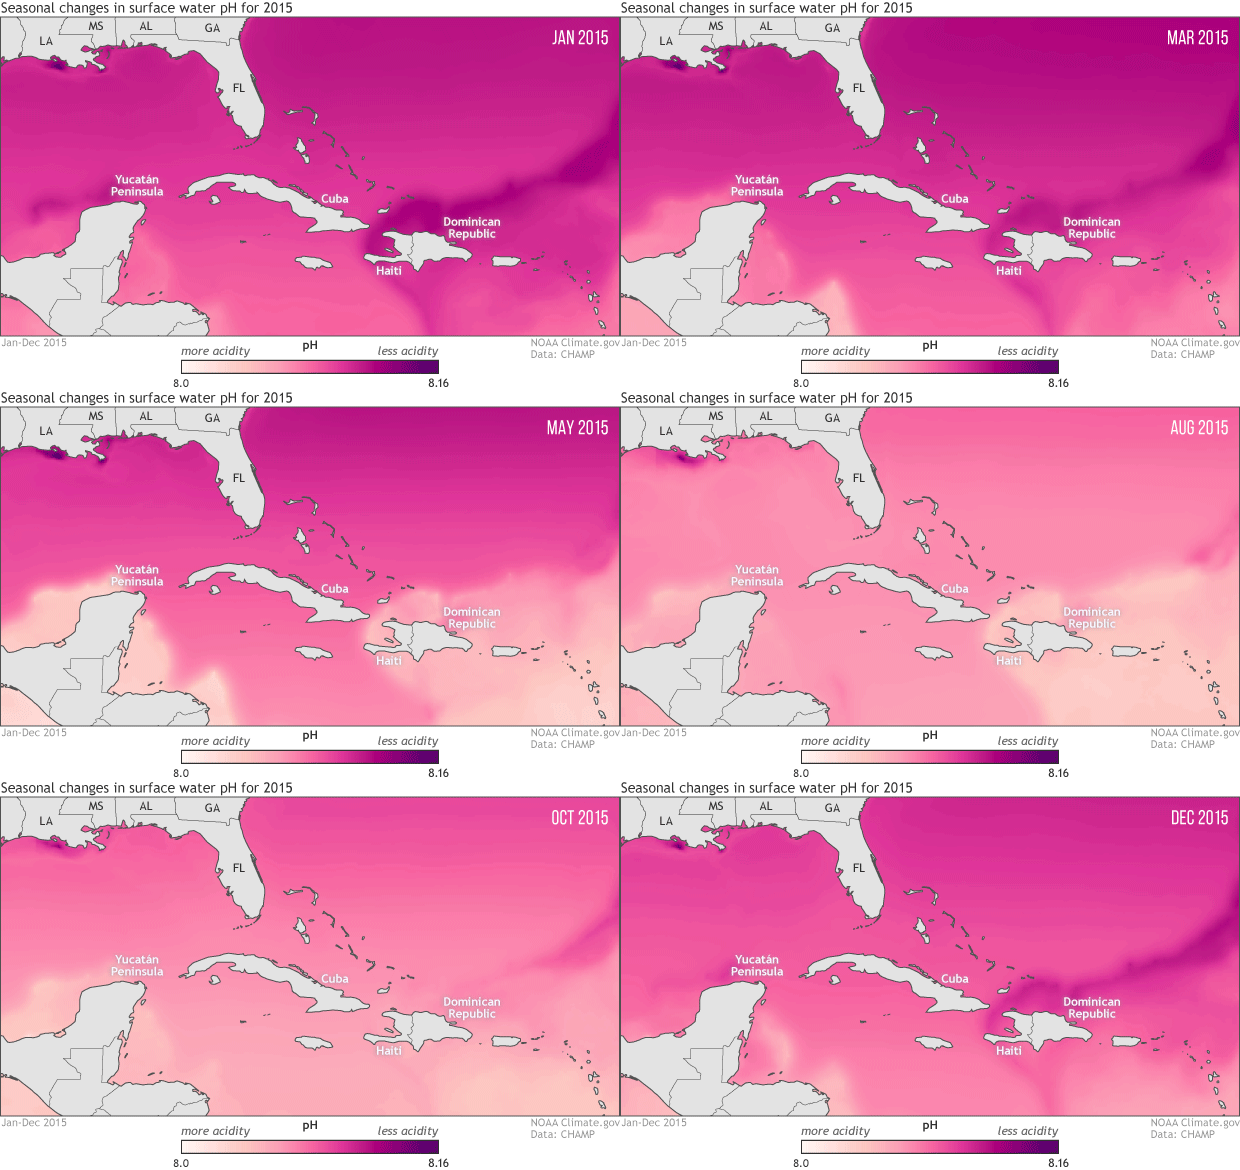
To protect marine life, NOAA monitoring seasonal and yearly changes in surface water pH in Caribbean Sea and Gulf of Mexico
Details
Since atmospheric carbon dioxide emissions began to increase after the Industrial Revolution, the acidity of the ocean’s surface waters has increased by 30%. This rising acidity—reflected in falling pH levels—harms shell-building creatures and other marine life. As part of their effort to protect our oceans and the communities that depend on them, NOAA scientists have developed a way to visualize and monitor monthly and yearly changes in surface water pH in the Caribbean Sea and Gulf of Mexico.
This animation shows monthly surface water pH during 2015, with darker pink and purple for areas with higher pH (lower acidity) and lighter pink and peach for areas with lower pH (more acidity). Seasonal changes in temperature drive the animation’s most obvious pattern: pH is generally higher in the coldest months of the year December-April) and lower in the warmest months (July-September).
As the water warms in the spring and summer, its ability to hold on to dissolved carbon dioxide weakens (think of a can of soda going flat on a hot summer day). As the solubility of carbon dioxide falls, its partial pressure in the water rises. Until the excess carbon dioxide is able to escape to the atmosphere, the rising pressure drives chemical reactions that increase the water’s acidity. The pattern reverses as the waters cool off.
The temperature-related changes can be amplified or weakened by other, overlapping processes: upwelling of deep waters; shifting of different water masses by currents; runoff of freshwater, sediment, and organic debris from rivers; and ocean plant growth. For example, in the northern Gulf of Mexico, the waters of the Mississippi Delta, offshore of Louisiana, have higher pH year round than the waters offshore of the Yucatan Peninsula, in the southern Gulf. And in the western Caribbean Sea and the tropical Atlantic (bottom right of image), the lowest pH values occur in June, even though the warmest sea surface temperatures occur in August and September.
In addition to these pH maps, NOAA scientists are also producing maps for multiple aspects of ocean carbon chemistry, including the basin’s buffering capacity (the ability to neutralize changes in pH) and the relative concentration of calcium carbonate minerals that corals and other organisms use to build their shells and skeletons. Data for these maps are updated monthly and initial results indicate good agreement with observed measurements from cruises and buoys.
The world’s oceans absorb about 30% of the carbon dioxide released into the atmosphere every year, which has already resulted in a 30% increase in acidity. But carbon dioxide emissions continue to rise. If we continue to emit carbon dioxide at current rates, estimates predict that surface water will be around 150% more acidic by the end of the century. That would be the highest acidity our oceans have seen for more than 20 million years.
People all over the U.S. and the world rely on the ocean for food, income, and industry. As ocean acidity rises, these industries and food sources may be at risk. In order to help mitigate that risk, NOAA continues to invest in products like these maps in order to provide the most accurate, up to date, and user-friendly information about ocean acidification.
