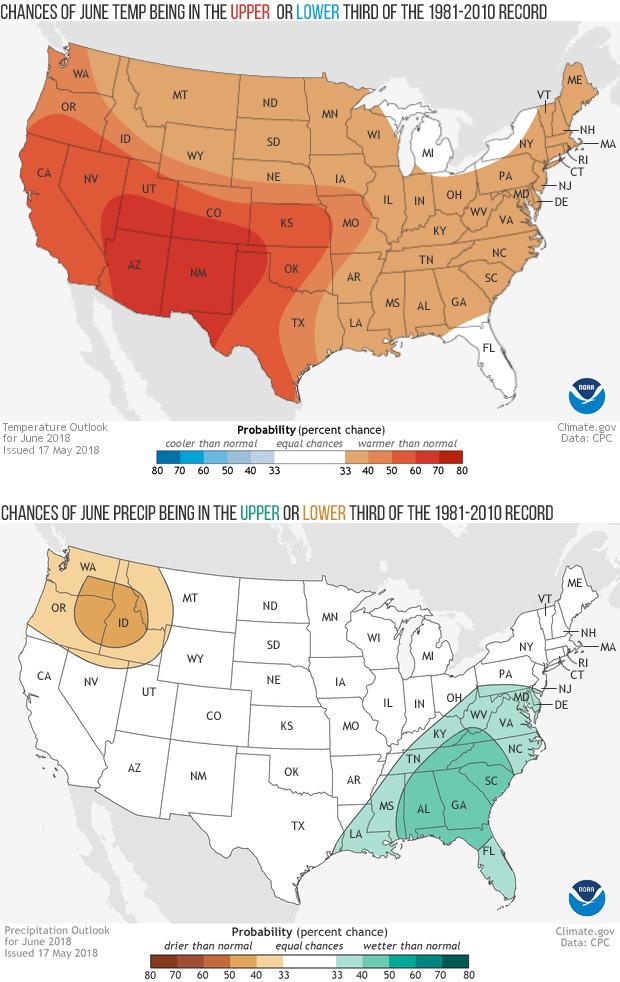
Relative to the 1981-2010 climate record, where are the highest chances for a warm June?
Details
At NOAA, the gathering and processing of climate intelligence never stops. Even as scientists at the National Centers for Environmental Information were recapping April and gathering data for May, experts at the Climate Prediction Center were working on the temperature and precipitation outlooks for June, which are shown in these maps.
These maps use colors to show where average June temperature (top) or precipitation (bottom) are favored to be in the upper or lower third of the 1981-2010 record. Darker colors mean higher chances, not how extreme the conditions will be. Think of it like a lottery, where the prize (or the punishment, depending on how you look at it!) is the same for everyone, but some places are more likely to win than others. White areas mean no outcome is favored over another. Temperature or precipitation is as likely to be in the upper third of the climate record (33% chance) as it is to be in the middle or lower third (33% chance each).
Virtually the entire United States (including Alaska) is more likely to experience a relatively warm June than a relatively cool one, but the odds are higher in the Southwest (50-60% chance) than in the Northern Plains or Mid-Atlantic (33%-40%). Only Florida and Michigan fall completely into the “equal chances” category, meaning a relatively warm June, a cool June, or a near-average June are all equally likely.
Meanwhile, the climate system provided forecasters fewer definitive hints about which way precipitation was likely to go in June, which resulted in most of the country being assigned equal chances (white) that average monthly precipitation would be in the upper, lower, or middle third of the 1981-2010 climate record. The highest chances for a relatively wet June (40-50% chance) are found in the Southeast, while the highest chances for a relatively dry June are clustered in a tri-state area of the Northwest, affecting Washington, Oregon, and Idaho.
If you’d like to read some of the thinking behind the June outlook, or see products for different lead times, visit the Climate Prediction Center website.
