  • Home
  • News & Features
  • Maps & Data
  • Teaching Climate
  • About
  • Contact
  • FAQs
  • Site Map
  • What's New?
  • El Niño & La Niña

Climate news, stories, images, & video (ClimateWatch Magazine)

  • News
  • How the Climate System Works
  • Climate Change & Global Warming
  • Natural Climate Patterns
  • Climate Impacts
  • Observing & Predicting
  • Policy & Planning
  • Extreme Events
  • Home
  • News & Features
  • Images & Video
  • Sea ice update: 2014 Arctic winter maximum, Antarctic summer minimum

Sea ice update: 2014 Arctic winter maximum, Antarctic summer minimum

Author: 
Rebecca Lindsey
April 3, 2014

Arcticmax_Antarcticmin2014_620.jpg

Image Credit: 
NOAA View
NSIDC
NOAA Climate.gov
Alternate Versions: 

large image

Image icon large image
Share This: 
Topics: 
Seasons
Category: 
Natural Climate Patterns
Observing & Predicting
Department: 
Images & Video
Reviewer: 
Walt Meier
Julienne Stroeve

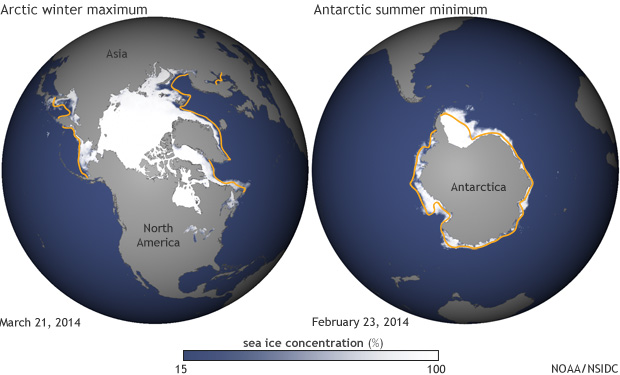
It’s finally here! Yesterday, scientists from the National Snow and Ice Data Center announced the ultimate sign of spring: Arctic sea ice reached its winter peak on March 21, 2014, and the annual melt season is underway.

This winter’s maximum sea ice extent in the Arctic was 14.91 million square kilometers (5.76 million square miles), making it the fifth smallest winter maximum since satellite records began in 1979.

Meanwhile, Southern Hemisphere sea ice reached its annual low point on February 23, 2014. This year’s summer minimum extent was 3.54 million square km (1.37 million square mi), which was the fourth largest in the satellite record.

Global warming due to rising atmospheric concentrations of carbon dioxide and other greenhouse gases is having different impacts on sea ice patterns in the Arctic versus the Antarctic. The Arctic is experiencing declines in ice cover in nearly all areas and all seasons, with especially large losses in summer.

In the Antarctic, sea ice trends are more variable. Over the Southern Ocean as a whole, sea ice extent has increased by a small amount on an annual basis, with decreases in some basins and increases in others and changes in some seasons but not others.

For more on differences between our planet’s two “ends of the Earth” see our Polar Opposites feature article.

Globes by Dan Pisut, based on data provided by the National Snow and Ice Data and available from NOAA View.

Related

2013 Arctic Report Card: Sea ice extent larger than 2012 record low, but still sixth smallest on record

December 9, 2013

Polar Opposites: the Arctic and Antarctic

July 10, 2011

You Might Like

If things go as “normal,” most U.S. locations will have their hottest day of the year by the end of July

July 7, 2020

Summer's over in the Arctic: sea ice extent sixth smallest on record

September 23, 2014

Despite regional cold extremes, January temperatures 4th warmest

February 27, 2014

Arctic Sea Ice Shrinking Rapidly

July 2, 2010

climate.gov

  • Home
  • News & Features
  • Maps & Data
  • Teaching Climate
  • About
  • Contact
  • FAQs
  • Site Map
  • What's New?

Follow Climate.gov

Follow us on twitter
Follow us on Facebook
Follow us on Instagram

Subscription link to sign up for Climate.gov's weekly update newsletter

2014 Webby Award winning website

Webby Award Webby Award

Click each award to learn more

  • Information Quality
  • NOAA Freedom of Information Act
  • Privacy Policy
  • Disclaimer
  • USA.gov
  • ready.gov