U.S average temperature right at freezing for January, rain and snow a bit above average
Details
[Update: Feb. 15, 2013] The original headline described January’s 0.14 inch precipitation anomaly as “near average.” We have revised the headline to conform to the language of the official ranking methods of NOAA’s National Climatic Data Center, under which January precipitation edged into the “above average” category.
Despite several snowstorms associated with cold-air outbreaks, average January temperatures across the contiguous United States weren’t especially cold according to the latest statistics from NOAA’s National Climatic Data Center. Although the average temperature was spot-on freezing—32.0° Fahrenheit—that was still 1.6° Fahrenheit warmer than the twentieth-century January average. Precipitation was regionally extreme, with contrasting areas having a top-ten-wet and top-ten-dry January, averaging out to a national total of 2.36 inches, just 0.14 inch wetter than the long-term average.
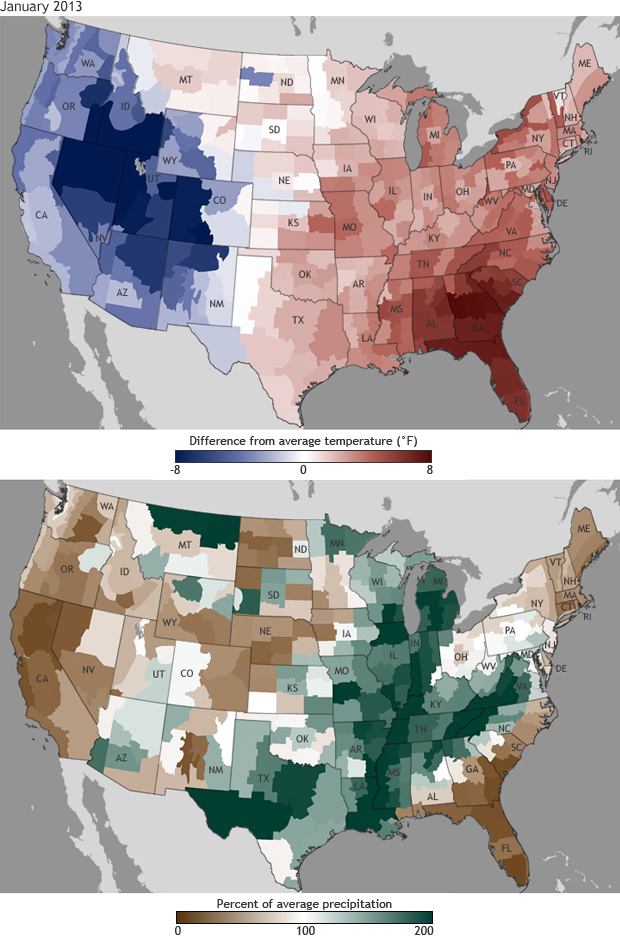
The maps above show the January 2013 temperature differences from the 1981–2010 average (top) and the percent of average precipitation (bottom) across the United States during the month. (Precipitation is the liquid water equivalent of all rain, snow, and sleet.) Reds and blues show temperatures up to 8° Fahrenheit warmer or cooler than average, respectively. The darker the color, the larger the difference from average. On the precipitation map, brown areas received less than 100 percent of their average January precipitation, and green areas received more than 100 percent of average.
As the red areas of the temperature anomaly map indicate, the eastern half of the contiguous United States saw warmer-than-average conditions in January. The Southeast was the most unusually warm region of the country; Georgia and Florida both had their 11th warmest January monthly temperatures. However, as the blue shades on the temperature anomaly map demonstrate, the western United States saw below-average temperatures throughout the month. Nevada had its ninth-coolest January on record, and Utah had its eighth coolest January on record.
Wetter-than-average conditions stretched from the Southern Plains to the Mid-Atlantic, where Louisiana, Mississippi, Tennessee, Michigan, and Virginia each had January precipitation totals ranking among their ten wettest. Unfortunately, the above-average precipitation generally missed the core drought areas of the central and southeastern United States, as the shades of brown on the map indicate. Drier-than-average conditions occurred along the West Coast, the central Rockies, and parts of the Northern Plains, Southeast, and Northeast. California, Connecticut, and Florida each had one of their ten driest Januarys. These wet and dry extremes averaged out to a near-normal January precipitation total for the contiguous United States.
These climate statistics and many others are part of NOAA’s National Monthly Climate Report. The National Climatic Data Center produces these monthly climate reports as part of the suite of climate services that NOAA provides government, business, and community leaders so they can make informed decisions.
Caption by Susan Osborne and Jake Crouch, adapted from the January 2013 National Climate Report from the National Climatic Data Center (NCDC). Reviewed by Jake Crouch, National Climatic Data Center.
