U.S. energy savings due to global warming? Not so fast...
Details
Warmer winters will decrease energy demands for heating, but on average, people living in the contiguous United States are not likely to see a net energy savings. According to the Third National Climate Assessment (NCA), higher summer temperatures will further increase electricity use as more people turn to air conditioners for relief, causing higher summer peak loads.
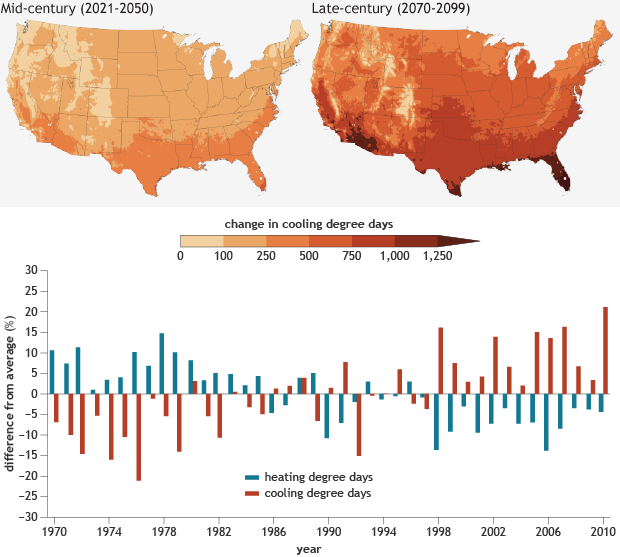
The maps show projected changes in average energy demand for cooling (cooling degree days) for two future time periods: mid-century (2021-2050) and end of century (2070-2099), both compared to the 1971-2000 average. The projected changes are based on a scenario (A2) that assumes greenhouse gas emissions continue increasing throughout this century. The southern United States experiences the greatest increase in cooling degree days.
According to the NCA, annual average temperatures typically have been higher than the long-term average over the last 20 years; nationally, temperatures were above average (1970-2010) during 12 of the last 14 summers. As the graph belows the maps shows, this change translated into increases in population-weighted cooling degree days compared to average, which resulted in increased air conditioning use, and decreases in population-weighted heating degree days.
Notice how the pattern of the colored bars for heating versus cooling demand flips on either end of the graph. Since the late-1990s, the energy needed for cooling buildings down on warm days (orange bars) has been above the line (greater than average), while the energy for heating them on cool days (blue bars) has been below the line (below average). Overall, the increase in cooling needs is greater than the decrease in heating needs.
The concept of cooling and heating degree days was developed by engineers who wanted a way to relate each day's temperatures to the energy demands of air conditioning and the demand for fuel to heat buildings. A “degree day” indicates that the daily average outdoor temperature was one degree higher or lower than 65°F—a typical baseline used by the National Oceanic and Atmospheric Administration (NOAA)—on a particular day. The total number of heating or cooling degree days over a year is roughly proportional to the annual amount of energy that would be needed to heat or cool a building in that location.
Many factors besides climate change affect energy demand across the regions of the United States in different ways, including economic conditions, energy prices, consumer behavior, conservation programs, changes in energy-using equipment, and population growth. Population projections suggest continued shifts toward regions that require air conditioning in the summer, compounding the impact of temperature changes on increased energy demand.
The Third NCA report envisions a future where the burden of meeting demands for cooling will fall to the electrical grid, which handles virtually the entire cooling load. (The heating load is distributed among electricity, natural gas, heating oil, passive solar, and biofuel.) Electricity at peak demand typically is more expensive to supply than at average demand. In order to meet the increased demands for peak electricity, additional generation and distribution facilities will be needed, or demand will have to be managed in other ways. A study by the National Renewable Energy Laboratory suggests that new energy-efficient technologies like wind and solar could help to offset the growth in demand without decreasing reliability.
Images adapted from Figures 4.2 and 4.3 from the Energy Supply and Use chapter of the Third National Climate Assessment.
References
Dell, J., S. Tierney, G. Franco, R. G. Newell, R. Richels, J. Weyant, and T. J. Wilbanks, 2014: Ch. 4: Energy Supply and Use. Climate Change Impacts in the United States: The Third National Climate Assessment, J. M. Melillo, Terese (T.C.) Richmond, and G. W. Yohe, Eds., U.S. Global Change Research Program, 113-129. doi:10.7930/J0BG2KWD.
Hand, M. M., S. Baldwin, E. DeMeo, J. M. Reilly, T. Mai, D. Arent, G. Porro, M. Meshek, and D. Sandor, 2012: Renewable Electricity Futures Study (Entire Report). NREL/TP-6A20-52409. National Renewable Energy Laboratory (NREL).
Questions about heating, cooling degree days. National Weather Service - Cleveland, Ohio.
Wilbanks, T., D. Bilello, D. Schmalzer, and M. Scott, 2012: Climate Change and Energy Supply and Use. Technical Report to the U.S. Department of Energy in Support of the National Climate Assessment. 79 pp., Oak Ridge National Laboratory, U.S. Department of Energy, Office of Science, Oak Ridge, TN.
2012 National Population Projects. United States Census Bureau.