A warm pool in the Indo-Pacific Ocean has almost doubled in size, changing global rainfall patterns
Details
Due to human-caused climate change, our planet’s ocean has been heating up at a rate of 0.06 degrees C (0.11 degrees F) per decade over the past century. But this warming isn’t uniform. In fact, recent NOAA-funded research shows that a large pool of the ocean’s warmest waters, stretching across the Indian and west Pacific Oceans, has grown warmer and almost doubled in size since 1900. This expanding warm pool not only impacts ocean life; according to the study, it is driving changes in the Madden Julian Oscillation (MJO), a key weather and climate pattern, and in regional rainfall around the globe.
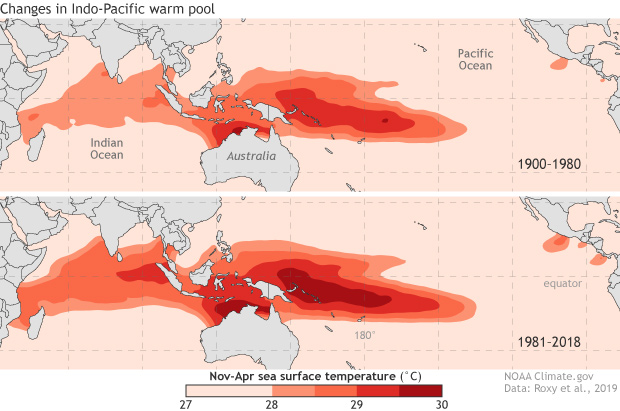
These maps show the Indo-Pacific Warm Pool—a region where sea surface temperatures remain above 28°C (82.4°F) year-round—in November-April for 1900-1980 (top) and 1981-2018 (bottom). Darker colors mean warmer temperatures. Across the full time period studied, from 1900-2018, the warm pool has expanded on average by the size of Washington State (230,000 km² or 88,800 mi²) per year. In recent decades, from 1981-2018, the warming rate has accelerated, adding an area the size of California (400,000 km² or 154,000 mi²) each year.
The warming is uneven across the region, with greater warming in the west Pacific. This unevenness creates a temperature contrast that enhances cloud-forming winds, moisture, and energy over the region, and it draws in warm moist air from the Indian Ocean. The uneven expansion of the Warm Pool has warped the MJO—a global pattern of clouds, wind, rain and pressure, active in the winter, that starts over the Indian Ocean and travels eastward around the tropics in 30-60 days. Though the total lifespan of its global trek has stayed the same, the study finds that the MJO’s clouds and rain now spend 3-4 fewer days over the Indian Ocean and 5-6 more days over the Maritime Continent and west Pacific, fueled by heat and moisture where the warming is greater.
These changes far away in the Pacific and Indian Oceans don’t just affect weather in the tropics. Along its journey, the MJO interacts with the global atmospheric circulation; it can influence everything from monsoons and the El Niño-Southern Oscillation to tropical cyclones and other extreme events like heat waves and snowstorms in the United States.
According to the study, the warm pool expansion is linked to altered winter-spring precipitation in regions across the planet. The east and west coasts of the United States, Ecuador, the central Pacific, the Yangtze basin in China, northern India, and east Africa have all seen dryer conditions, while the Amazon basin, northern Australia, southeast Asia, and southwest Africa have seen wetter conditions. The researchers noted they can’t say for certain that all these changes are caused by the warping of the MJO. The Warm Pool itself could be affecting global precipitation by influencing additional aspects of the large-scale atmospheric circulation. Regardless of the culprit, with climate models projecting that our oceans will continue to warm, we could see these impacts on the MJO and global rainfall patterns intensify further in the future.
This study was funded in part by the NOAA Climate Program Office’s Climate Variability and Predictability (CVP) Program, which supports research to improve our understanding of interactions among the atmosphere, ocean, and land, and how they work together to make weather and climate events. It is part of a collaboration between NOAA and India’s Ministry of Earth Sciences, facilitated by the National Academy of Sciences.