As the World Churns: the Gulf of Mexico and Ocean Circulation
Details
Since the Deepwater Horizon wellhead exploded on April 20, 2010, people around the world have wondered: where is the leaking oil likely to go, and what is its fate? Conditions throughout the Gulf of Mexico change hour-to-hour and day-to-day. Yet a much longer-term perspective about the region is essential for making the best possible decisions. “Long-term” is generally where climate comes in. To answer questions about how oil from the wellhead will move and change over time, scientists within NOAA and beyond are relying on climate data and climate models to prepare for the many possible effects of the spill on conditions throughout the Gulf of Mexico, Caribbean Sea, and the Atlantic Ocean.
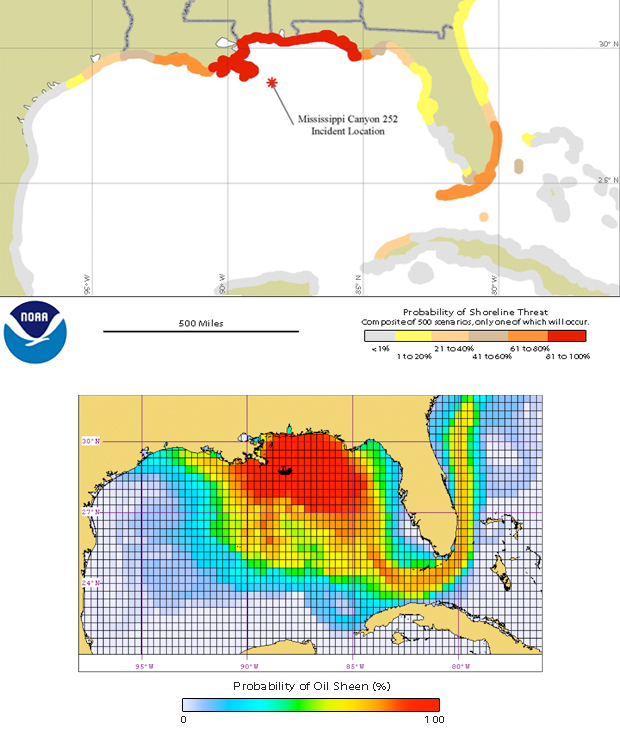
To anticipate which shorelines are most threatened by oil and its residuescientists at NOAA analyzed 15 years of data on past winds and ocean currents to map the likelihood of oil approaching shorelines. Winds and currents vary for myriad reasons, so scientists used computers to repeatedly examine portions of the 15-year data set for clues about where oil might move over time. They computed 500 possible scenarios that addressed oil movement and its breakdown by sunlight, bacteria, and other natural processes. Each simulation tracked the release and dispersal of oil during a 120-day period following the Deepwater Horizon wellhead explosion.
The colors on the map above denote the percentage of scenarios that yielded a dull sheen, weathered streamers, or tar balls within 20 miles of land. A “dull sheen” is potentially enough oil to be toxic to some organisms in the water and could require the closure of fisheries. Each scenario accounted for oil breakdown and variations in flow due to efforts to contain the oil leak.
Both maps above show an 81 to 100 percent likelihood of oil sheens or tar balls approaching coastlines from the Mississippi River Delta to the panhandle of Florida, where oil residues have already been identified. Much of the coast of Texas shows a relatively low probability (ranging from less than one percent in southern Texas to up to 40 percent near the Louisiana border) that oil will approach the coast because climate data show most currents move eastward in this region. The west coast of Florida has a low probability (1 to 20 percent), but the Miami and Fort Lauderdale areas have higher probabilities (61 to 80 percent) because a steady stream of ocean water continually rushes past Florida’s southern shore in a band known as the Florida Current. The Florida Current feeds the Gulf Steam, whose northeastern flow trends away from the continental U.S. The relatively low probability of shoreline impacts from eastern central Florida northward along the eastern seaboard is due to the Gulf Stream and the expected breakdown of oil over time.
The probability maps could help reduce impacts of the oil leak. Using climate data to map the most threatened coastlines, responders are better able to target their efforts to prevent oil byproducts from ever coming ashore. Knowing where oil might come ashore will allow those responders to take measures to block, clean, or minimize impacts of oil byproducts on land. Understanding how ocean currents move through time and space will continue to help responders prepare for possible impacts of the Deepwater Horizon incident.
Related Links
Press Release: Long Term Outlook from NOAA’s Office of Response and Restoration.
NOAA Deepwater Updates: NOAA’s Office of Response and Restoration
Ocean measurements: U.S. Navy
Image treatment by Ned Gardiner based on a more complete analysis by NOAA’s Office of Response and Restoration.
