2010 Climate Events Connected to El Niño or La Niña
Year in Review
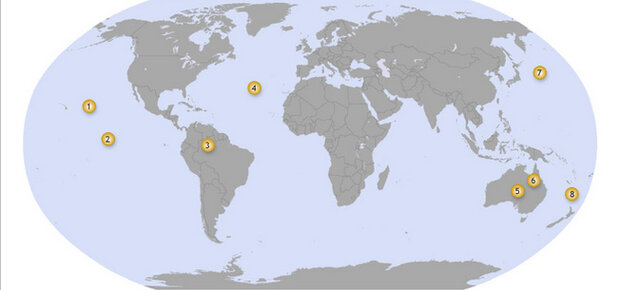
In 2010, the El Niño-Southern Oscillation ("ENSO," for short) climate pattern swung first through its warm phase and then its cool phase, with significant influences on seasonal climate around the globe. From drought in the Amazon to Australia's record spring rains, the clickable map above highlights significant regional climate events in 2010 that were influenced by ENSO.
ENSO is a natural pattern of seesawing changes in ocean temperatures and winds in the tropical Pacific Ocean. The pattern has two end points: El Niño (the warm phase) and La Niña (the cool phase). During El Niño events, the easterly trade winds that blow across the tropical Pacific Ocean are weaker than usual and sea surface temperatures in the central and eastern Pacific become warmer than usual. During La Niña events, the pattern is reversed: easterly trade winds are stronger than usual, and sea surface temperatures in the central and eastern Pacific are cooler than usual.
These wind and temperature anomalies create a ripple effect through the global atmospheric circulation, influencing temperature and precipitation patterns throughout the tropics and sub-tropics. By analyzing decades of weather observations, climate scientists have identified some predictable teleconnections—long-distance relationships—between seasonal climate in places around the world and the phase of ENSO in the Pacific.
Related
Climate Variability: Oceanic Niño Index
2010 Began with El Niño, Ended with La Niña
2010 La Niña Continuing the New Year
ENSO Information from NOAA's Climate Prediction Center
Event 1: Below-average hurricane activity in eastern North Pacific
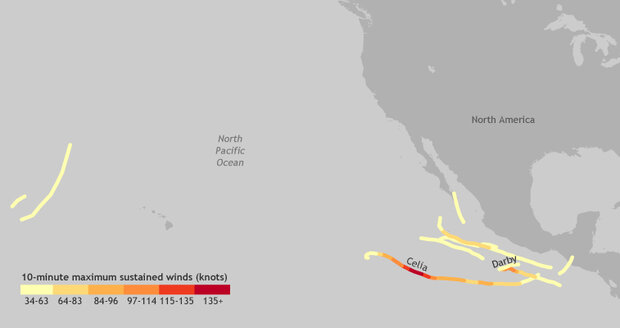
This map shows the path and 10-minute maximum sustained wind speeds of all named storms in the eastern and central Pacific Ocean during the 2010 hurricane season. Paths with names were major storms (Category 3 or stronger on the Saffir-Simpson scale). Map by Hunter Allen, based on International Best Track Archive for Climate Stewardship-World Meteorological Organization (IBTrACS-WMO) data.
Event Summary
The 2010 hurricane season in the eastern North Pacific was far below average, with only 8 named storms. Only 3 of the 8 storms reached hurricane strength, and only 2 became major hurricanes. In an average season, the basin experiences between 21 and 22 named storms. Between 12 and 13 of them become hurricanes, and between 6 and 7 become major hurricanes.
Connection to El Niño/La Niña
Hurricanes depend on evaporation from warm surface waters to fuel towering thunderstorms that develop into hurricanes, and during La Niña, sea surface temperatures are cooler than average in the eastern and central Pacific where hurricanes form. Wind patterns change during La Niña too. Easterly trade winds near the surface get stronger, which increases vertical wind shear. If winds at different altitudes are blowing strongly in different directions or at different speeds, storms tend to be torn apart before they can organize or intensify.
Kruk, M.C., Hennon, P.A., Gibney, E.J., Hobgood, J., and Weyman, J. (2011, June). Eastern North Pacific Basin. In State of the Climate 2010, Chapter 4: The Tropics (pdf). Published in the Bulletin of the American Meteorological Society, 92.
Knapp, K.R., Kruk, M.C., Levinson, D.H., Diamond, H.J., and Neumann, C.J. (2010). The International Best Track Archive for Climate Stewardship (IBTrACS). Bulletin of the American Meteorological Society, 91, 363–376.
Cold (la Niña) Episodes in the Tropical Pacific
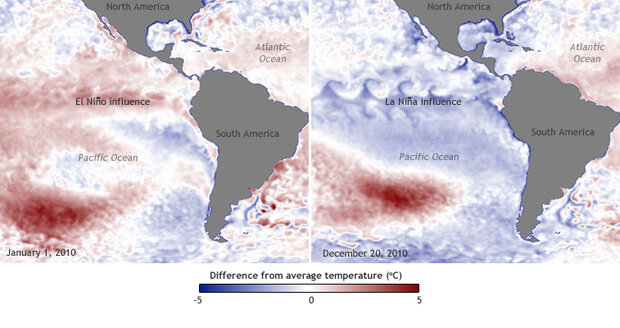
This pair of maps shows daily sea surface temperature on January 1, 2010, when El Niño was occurring, and on December 20, 2010, when La Niña was underway. (For a movie of daily sea surface temperatures throughout 2010, see 2010 Began with El Niño, Ended with La Niña.) Each map shows where sea surface temperatures were warmer (red), cooler (blue), or roughly the same as (white) long-term average (1980-2010) conditions. Maps by Dan Pisut, NOAA Environmental Visualization Lab, based on NOAA sea surface temperature data.
Event Summary
At the start of 2010, sea surface temperatures in the central tropical Pacific Ocean were up to 1.5 degrees Celsius above average and up to 1 degree warmer than average in the eastern tropical Pacific. By summer, the pattern had completely reversed. Temperatures across much of the tropical Pacific were up to 2 degrees Celsius cooler than average. The cooling phase had a bigger impact on the 2010 regional sea surface temperature; the tropical Pacific cooled by about 1 degree Celsuis from 2009 to 2010.
Connection to El Niño/La Niña
These sea surface temperature patterns aren't just "connected to" El Niño and Niña; together, they are fundamental parts of the El Niño-Southern Oscillation (ENSO) climate phenomenon itself. (Changes in wind patterns are the other necessary ingredient.) During El Niño, ocean surface temperatures in the central and eastern tropical Pacific Ocean get unusually warm. The opposite effect occurs when La Niña takes over; the same part of the ocean grows unusually cool.
The year began with the tropical Pacific under the warming influence of a strong El Niño event, but by July, La Niña had emerged and provided a cooling influence for the rest of the year. The Pacific is the world's biggest ocean, and swings in temperature and atmospheric patterns in the basin influence weather around the globe.
Thorne, P.W.. (2011, June.) Introduction. In State of the Climate 2010, Chapter 2: Global Climate (pdf). Published in the Bulletin of the American Meteorological Society, 92.
Xue, Y., Reynolds, R.W., Banzon, V., Smith, T.M., and Rayner, N.A. (2011, June.) Sea surface temperatures. In State of the Climate 2010, Chapter 3: Global Oceans (pdf). Published in the Bulletin of the American Meteorological Society, 92.
NOAA Climate Prediction Center – El Niño Southern Oscillation
La Niña Continuing in the New Year
Event 3: Worst drought in four decades in parts of Brazilian Amazon
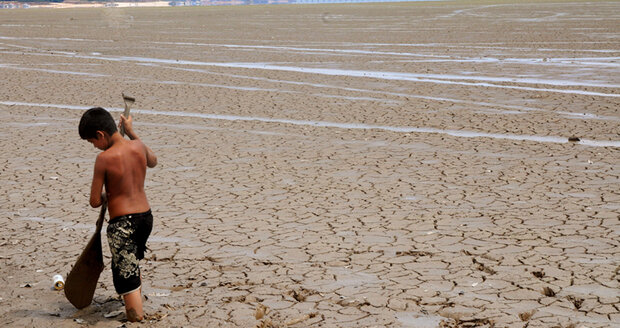
A boy walks along the riverbed of the Rio Negro, which was reduced to a fraction of its usual flow during the 2010 drought. Photo: Euzivaldo Queiroz/AFP/Getty Images. October 22, 2010.
Event Summary
North and west Amazonia experienced its worst drought in four decades during 2010. Drier-than-normal conditions were observed in northwestern, central, and eastern Amazonia during the Southern Hemisphere summer and the rest of Amazonia until the end of the year. The Rio Negro, the Amazon's largest left tributary, dropped to its lowest level (44.7 feet) since record keeping began 107 years ago.
Connection to El Niño/La Niña
Averaged over the span of weeks and months, the atmosphere over the Pacific Ocean circulates in a giant vertical loop called the Walker Circulation. Air rises over the warm waters of the tropical western Pacific, flows east at high altitudes, sinks back toward the surface over the eastern pacific, and flows west at the surface via the easterly trade winds. When air descends from high altitudes toward the surface it generally warms and dries; this process suppresses rainfall. During El Niño episodes, this whole loop shifts eastward. The zone of rising air is centered over the warmer-than-usual waters of the central and eastern tropical Pacific, and the sinking zone—where rainfall is suppressed—winds up over the eastern Amazon Basin. Although El Niño was probably a factor in the lack of rain in the eastern Amazon during the 2009/2010 rainy season (Northern Hemisphere winter), the drought affected the western Amazon as well, an area where scientists have not documented any connection to El Niño or La Niña. The dry conditions persisted into late 2010.
Marengo, J.A., Alves, L.M., Ronchail, J., and Baez, J. Tropical South America East of the Andes. (2011, June.) In State of the Climate 2010, Chapter 7: Regional Climates (pdf). Published in the Bulletin of the American Meteorological Society, 92.
Stealing the Rain from the Rainforest
Event 4:Atlantic hurricane activity above average
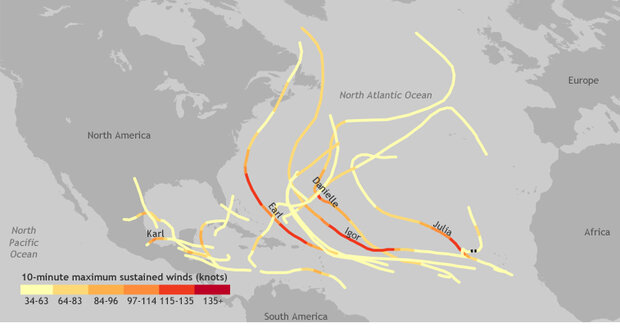
This map shows the path and 10-minute maximum sustained wind speeds of all named storms in the Atlantic Ocean during the 2010 hurricane season. Paths with names were major storms (Category 3 hurricanes or stronger on the Saffir-Simpson Scale). Black dashed lines indicate a drop in intensity to below tropical storm strength. Map by Hunter Allen, based on International Best Track Archive for Climate Stewardship-World Meteorological Organization (IBTrACS-WMO) data.
Event summary
The Atlantic basin was the only region of the world with an unusually active hurricane season in 2010. In fact, the season qualified as "hyperactive," with the number of storms and hurricanes at least 175 percent of normal. The Atlantic spawned 19 named storms, of which 12 became hurricanes, and 5 became major hurricanes. While no hurricanes made landfall in the United States in 2010, two came ashore in eastern Canada, which was only the third season since 1951 when eastern Canada experienced more than one landfalling hurricane. In fact, 60 percent of hurricane seasons pass without even a single landfalling hurricane in Canada, although the remnants of tropical storms are not uncommon there.
Connection to El Niño/La Niña
La Niña episodes cool the eastern tropical Pacific, and they disrupt the normal winds patterns at the ocean surface and at higher altitudes. These disruptions affect the atmosphere "downstream" of the Pacific as well. During La Niña, the amount of vertical wind shear over the tropical Atlantic where hurricanes form declines. Given other favorable conditions, including warmer than-average ocean surface temperatures, low wind shear contributes to enhanced seasonal hurricane activity.
Event 5: Cool spring in Australia
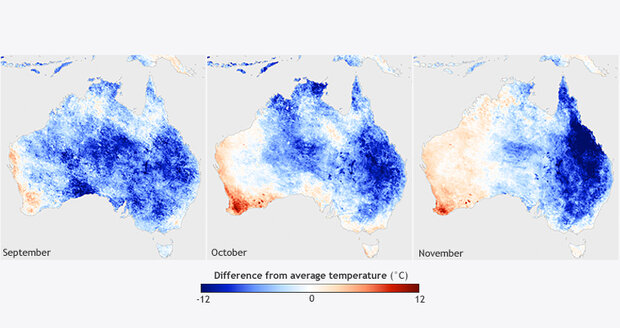
This trio of maps shows daytime land surface temperature anomalies measured by NASA's Terra satellite in September, October, and November 2010 compared to the average of the past decade. Places that were cooler than average are blue, places with average temperatures are white, and places where temperatures were warmer than average are red. "Land surface temperature" is not the same as air temperature; it is an estimate of how hot the ground or other surface in the satellite's field of view would feel to the touch. Because land surfaces often heat up and cool down more rapidly than water or air, land surface temperature anomalies are sometimes larger than air temperature anomalies in the same area. Maps by Ned Gardiner and Hunter Allen, based on data provided by the NASA Earth Observations (NEO) Website.
Event Summary
Nearly all of Australia experienced cooler-than-average temperatures in September 2010, the first month of spring in the Southern Hemisphere, and the unusually cool conditions persisted across the central and eastern part of the country into November. Temperatures were up to 4 degrees Celsius cooler than average in Central Australia and more than 5 degrees Celsius cooler than average across much of Queensland.
Connection to El Niño/La Niña
Heavy, in some cases record-breaking, rain fell across eastern and central Australia in late 2010 in connection with La Niña. The rain cools temperatures off in two ways. Overcast skies in the daytime provide shade, reflecting sunlight back into space. When the sun does come out, water evaporates from the soggy ground, which keeps the surface cool.
Ganter, C., and Tobin, S. (2011, June). Australia. In State of the Climate 2010, Chapter 7: Regional Climates (pdf). Published in the Bulletin of the American Meteorological Society, 92. Power, S., T. Casey, C. Folland, A. Colman, and V. Mehta, 1999: Inter-decadal modulation of the impact of ENSO on Australia. Climate Dyn., 15, 319–324.
Power, S., T. Casey, C. Folland, A. Colman, and V. Mehta, 1999: Inter-decadal modulation of the impact of ENSO on Australia. Climate Dyn., 15, 319–324.
Centre for Australian Weather and Climate Research
National Climate Centre, Australian Bureau of Meteorology
Event 6: Wettest Australian spring on record
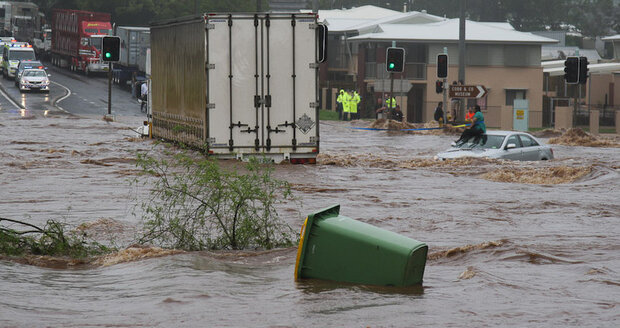
A woman is trapped on a car roof during flash flooding in Toowoomba, a city in southern Queensland. Photo: Timothy Swinson/Flickr.com. January 10, 2011
Event Summary
In 2010, Australia had its wettest year since 2000 and the third wettest year since records began in 1900. Australia as a whole experienced its wettest spring (September – November) on record. Weeks of heavy rain during December resulted in widespread floods across northeastern Australia. The worst floods occurred in Queensland, where 16 fatalities were reported and nearly 200,000 people were affected. These floods were the most significant in Australia since the 1970s.
Connection to El Niño/La Niña
Much of the flooding occurred in the second half of the year, during the strong La Niña event in the Pacific Ocean. During La Niña, a persistent zone of showers and thunderstorms (the South Pacific Convergence Zone) that normally sits far off the northeast coast of Australia in the spring is pushed closer to land by stronger-than-usual easterly trade winds. Evaporation from record-warm surface waters near Australia also fed extra moisture into the region, and repeated storms brought heavy, widespread rainfall inland. Additional rain came from tropical cyclones passing through the region.
Ganter, C., and Tobin, S. (2011, June). Australia. In State of the Climate 2010, Chapter 7: Regional Climates (pdf). Published in the Bulletin of the American Meteorological Society, 92. Power, S., T. Casey, C. Folland, A. Colman, and V. Mehta, 1999: Inter-decadal modulation of the impact of ENSO on Australia. Climate Dyn., 15, 319–324.
Power, S., T. Casey, C. Folland, A. Colman, and V. Mehta, 1999: Inter-decadal modulation of the impact of ENSO on Australia. Climate Dyn., 15, 319–324.
Centre for Australian Weather and Climate Research
National Climate Centre, Australian Bureau of Meteorology
Event 7: Typhoon season in the western North Pacific below average
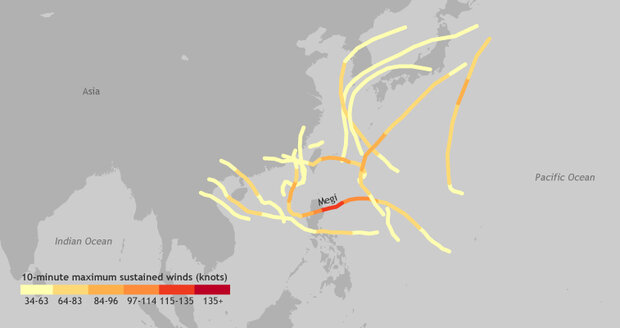
This map shows the path and 10-minute maximum sustained winds for all named storms in the western North Pacific during the 2010 typhoon season. The named storm track, Megi, was the only super typhoon of the season. Map by Hunter Allen, based on International Best Track Archive for Climate Stewardship-World Meteorological Organization (IBTrACS-WMO) data.
Event summary
In the western North Pacific, tropical cyclones are known as typhoons; this basin's storms affect the Philippines, China, and Japan. In 2010, the basin had just 14 named storms; only 8 reached typhoon strength (equivalent to at least a Category 1 storm on the Saffir-Simspon scale), and only 1 of those became a super typhoon (strong Category 4 or Category 5 storm on the Saffir-Simspon scale). It was the least active season in terms of named storms and typhoons in the historical record.
Connection to El Niño/La Niña
As the typhoon season in the western North Pacific reached its peak in the late summer and early fall of 2010, La Niña was underway. During La Niña episodes, the location where cyclones in this basin originate gets pushed farther west and north than usual, in part due to stronger-than-usual easterly trade winds. This northwest shift delivers two strikes against typhoons. First, more northerly waters are cooler, which means less heat energy is available to fuel the storms. Second, storms start out closer to land, and so they have less chance to intensify over open water before being weakened by landfall.
Camargo, S. J. (2011, June). Western North Pacific. In State of the Climate 2010, Chapter 4: The Tropics (pdf). Published in the Bulletin of the American Meteorological Society, 92.
Knapp, K.R., Kruk, M.C., Levinson, D.H., Diamond, H.J., and Neumann, C.J. (2010). The International Best Track Archive for Climate Stewardship (IBTrACS). Bulletin of the American Meteorological Society, 91, 363–376.
Event 8: Southwest tropical Pacific cyclone hotspot shifted east of dateline
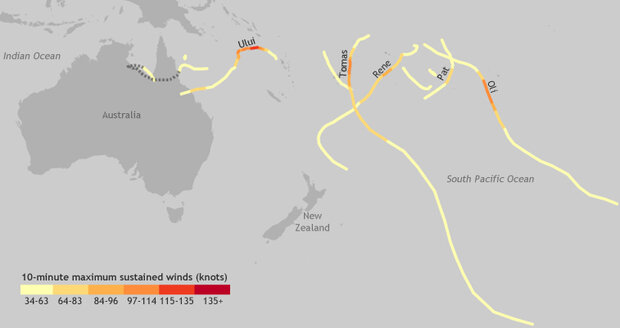
This map shows the path and 10-minute maximum sustained wind speeds of all tropical cyclones in the Southwest Pacific basin during the 2009/2010 season. Paths with names were major tropical cyclones. Dashed line indicates wind speeds below 34 knots. Map by Hunter Allen, based on International Best Track Archive for Climate Stewardship-World Meteorological Organization (IBTrACS-WMO) data.
Event summary
The South Pacific basin stretches from French Polynesia, around 120° West, to northern Australia's Gulf of Carpentaria, at around 135° East. The tropical cyclone season runs from November to April (Southern Hemisphere late spring to early fall). During the 2009-2010 season, the basin experienced 10 named storms, which is slightly below the long-term average of 12-13 per season. Five were major tropical cyclones (Category 3 or higher on the Australian Bureau of Meteorology Tropical Cyclone Intensity Scale.) The majority of storms were concentrated east of the dateline, which is just east of New Zealand.
Connection to El Niño/La Niña
In the South Pacific, the tracks of tropical cyclones are influenced by the location of the subtropical jet stream and the South Pacific Convergence Zone—a persistent band of cloudiness and rain where winds from different directions converge. This rainy zone generally extends southeast from near the equator in the Western Pacific toward French Polynesia. It's exact location in any given season depends in part on the strength of the easterly trade winds blowing across the Pacific.
During El Niño, which was in occurring in early 2010, the easterly trade winds are weaker than usual, and the South Pacific Convergence Zone slides northeast of where it is during other phases of the El Niño-Southern Oscillation. The location of the 10 tropical cyclones in the basin during the 2010 season was consistent with that pattern. Similar to analog seasons from 1957-58, 1976-77, 1986-87, and 2006-07, much of the activity was concentrated east of the dateline.
Lorrey, A.M., McGree, S., Renwick, J., and Hugony. S. (2011, June). Southwest Pacific Basin. In State of the Climate 2010, Chapter 4: The Tropics (pdf). Published in the Bulletin of the American Meteorological Society, 92.
Diamond, H.J., Lorrey, A.M., Knapp, K.R., and Levinson, D.H. (2011). Development of an enhanced tropical cyclone tracks database for the southwest Pacific from 1840 to 2010. International Journal of Climatology. (Early view, DOI: 10.1002/joc.2412).
Knapp, K.R., Kruk, M.C., Levinson, D.H., Diamond, H.J., and Neumann, C.J. (2010). The International Best Track Archive for Climate Stewardship (IBTrACS). Bulletin of the American Meteorological Society, 91, 363–376.