2015 Arctic Report Card: Visual Highlights
Funded by NOAA's Climate Program Office, this year's Arctic Report Card documents that air temperature in 2015 across the Arctic was well above average with temperature anomalies over land more than 2 degrees Fahrenheit above average, the highest since records began in 1900. The 2015 report features updates on key indicators as well as new reports on the status of walrus, the northward movement of fishes, increasing river discharge into the Arctic Ocean, and the importance of community-based monitoring. Explore our collection of visual highlights below.
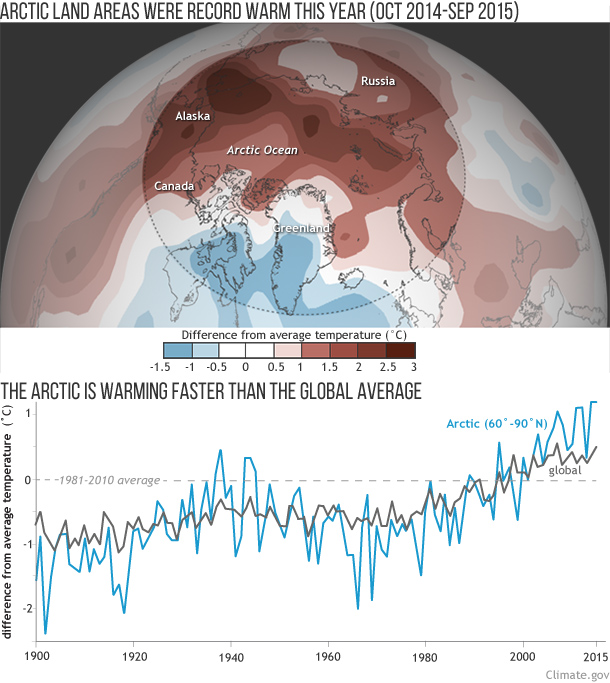
“Arctic amplification” of climate change remained in full swing in 2015. Broad areas of the Arctic were more than 5°F (3°C) warmer than average during the report card’s monitoring year (October 2014-September 2015), with temperatures over land areas record warm. The increase in temperature over Arctic regions continued to outpace the global average. Read more.

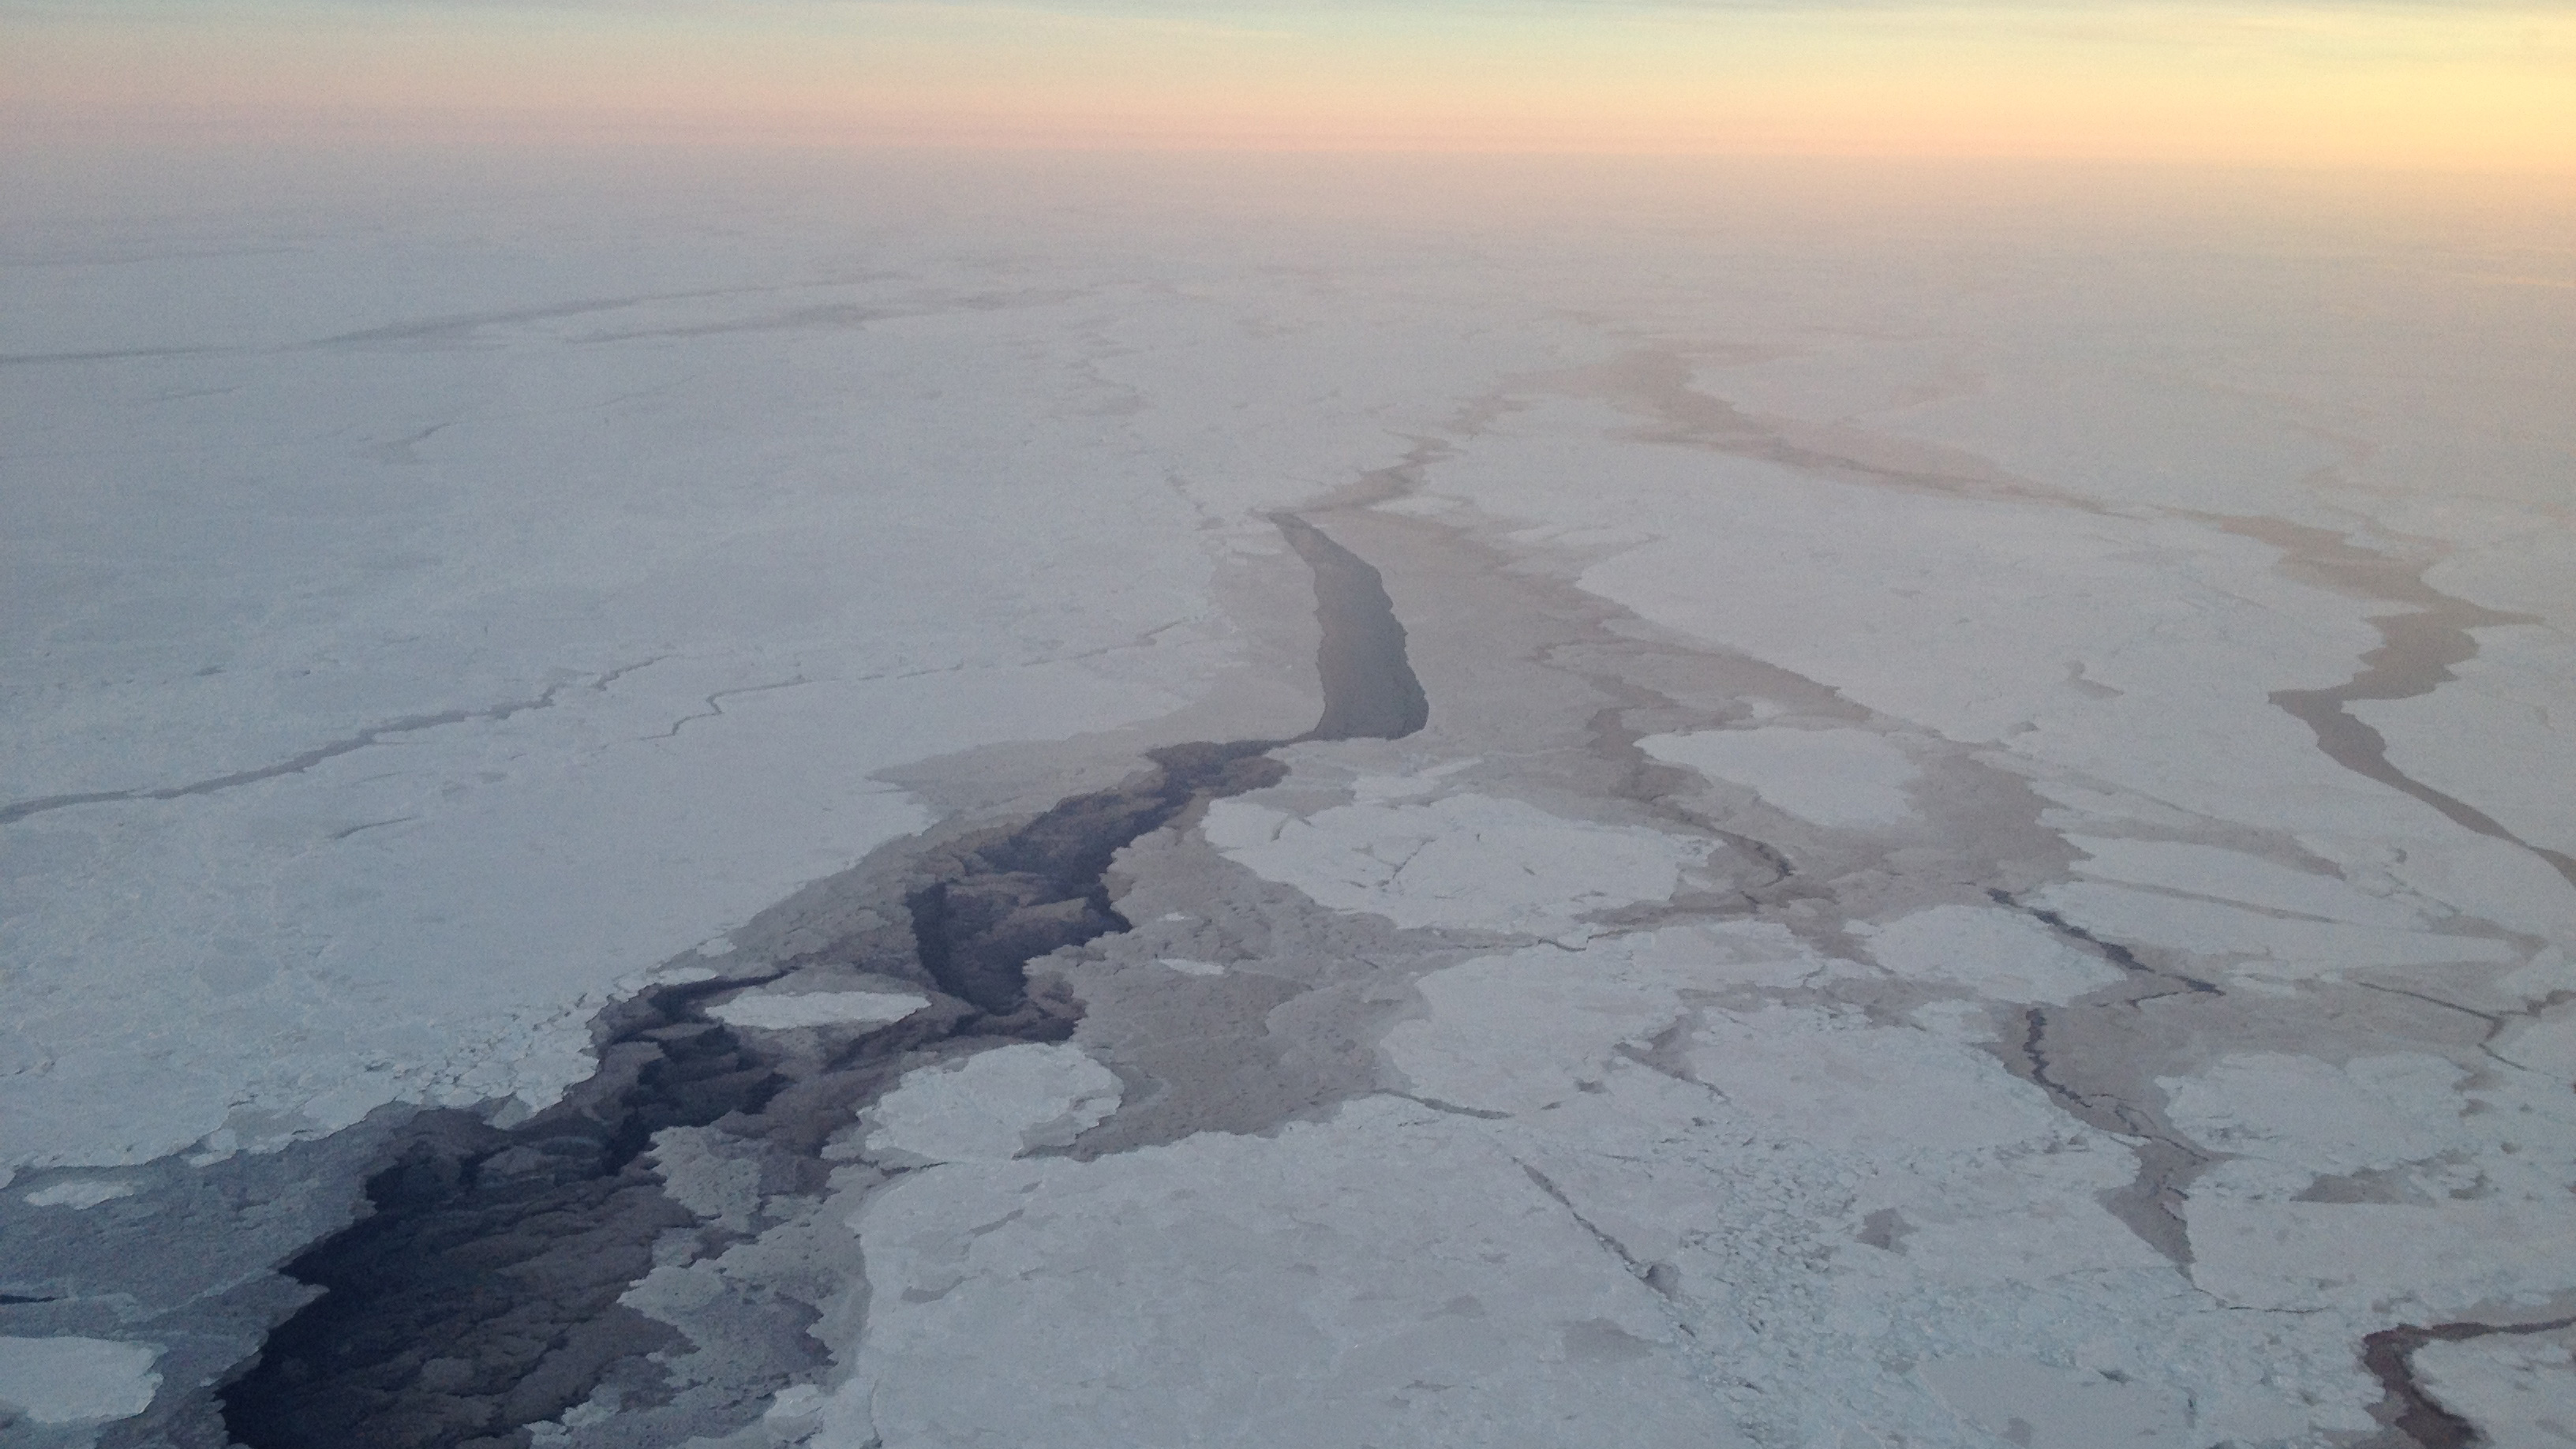
Ten years ago, Arctic sea ice set a new record unlike anything previously observed. The 2015 low is 350,000 square miles below that. In fact, the nine lowest Arctic sea ice extents in the satellite record have all occurred in the last nine years. Read more.
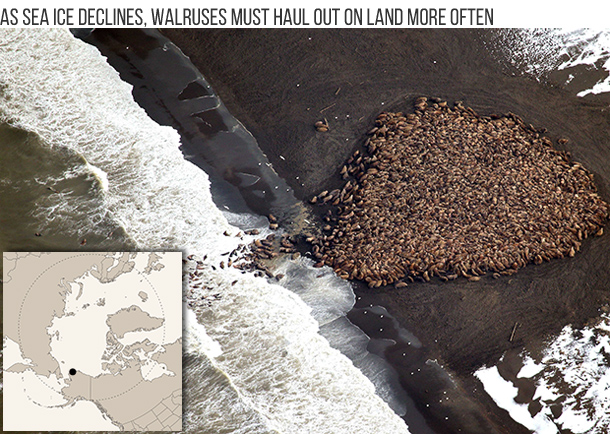
Like polar bears and seals, walruses depend on sea ice for mating, giving birth, and resting, which means they face an increasing threat from global warming. But recent population trends are so heavily influenced by hunting pressures dating back hundreds of years that using current status to predict future impacts is far from straightforward. Read more.
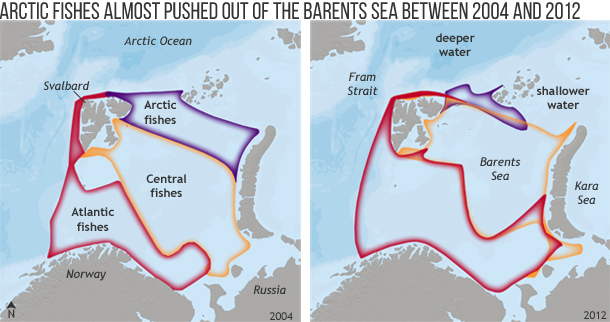
Marine ecosystems in the Barents Sea—a sub-arctic shelf sea bordering the Arctic Ocean—are warming faster than the global average, contributing to a northward shift in fish species. Not only are there now bigger fish to fry in the region, but scientists predict the natural marine ecosystem will undergo a transformation. Read more.

The Greenland Ice Sheet holds some 684,000 cubic miles of our planet's fresh water as ice. If the Greenland Ice Sheet were to melt away completely, ocean level would rise roughly 23 feet. In 2015, the melt season was up to 30 to 40 days longer than average in western, northwestern, and northeastern Greenland, but was close to or below average elsewhere on the ice sheet. Read more.

As the Arctic has warmed over the past three decades, satellites reveal it has also been "greening up" overall, a sign that vegetation has generally become leafier or denser. But in recent years, the tundra has been “browning down,” for reasons that are still to be explained. Read more.
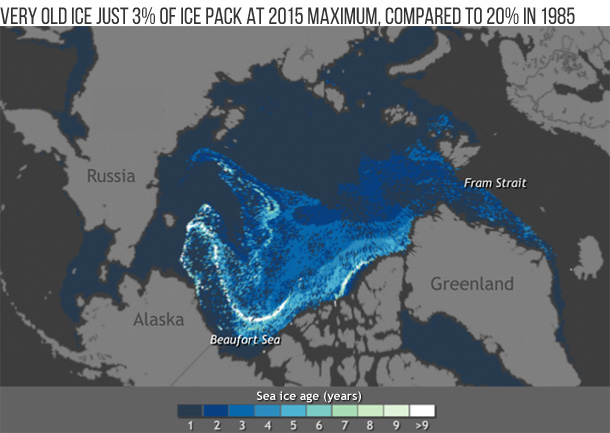
Since the 1980s, the amount of perennial ice (multiyear ice) has declined dramatically. In 1985, 20% of the ice pack was very old ice, but in March 2015 old ice only constituted 3% of the ice pack. First-year ice now dominates the ice cover, comprising ~70% of the March 2015 ice pack, compared to about half that in the 1980s. View animation and more details.
Related Content
NEWS & FEATURES
01/18/2015
MAPS & DATA
06/23/2025
06/23/2025
07/27/2021
CLIMATE RESILIENCE TOOLKIT
08/22/2015
10/10/2016
05/04/2015