Antarctica is colder than the Arctic, but it’s still losing ice
Compared to the Arctic, Antarctica is responding less rapidly to climate change. Water’s melting point, 32°F, is a critical threshold for rapid change in polar regions, and only a small fraction of the snow on Antarctica’s miles-high ice sheet reaches that temperature in summer. Antarctica is also surrounded by a vast ocean, and it’s buffered by winds and weather patterns that tend to isolate it from large warm-air intrusions. Still, the frozen continent has become warmer, and has lost billions of tons of ice as a result. Its future responses to warming air and ocean could have worldwide consequences.
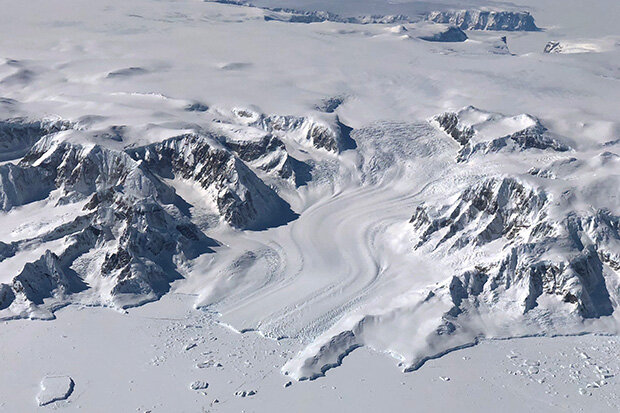
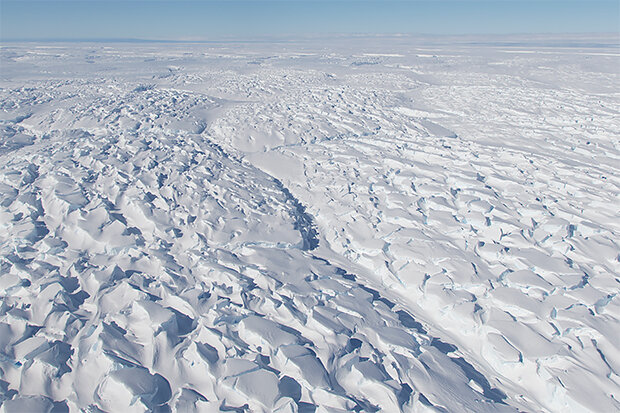
A portion of the West Antarctic Ice Sheet (background) drains into the ice-covered Bellinghausen Sea (foreground) via an S-shaped glacier (center). The top of the glacier is rippled with crevasses, indicating the ice is flowing quickly over steep terrain. NASA Operation IceBridge photo by Kate Ramsayer.
Antarctica 101
Though it’s about as far from the equator as the Arctic, and though it’s also largely frozen, Antarctica is in many ways the Arctic’s opposite. The Arctic is an ice-covered ocean basin surrounded by landmasses; Antarctica is a continent surrounded by a vast ocean. Roughly the size of the contiguous United States and Mexico combined, Antarctica extends from 60°S to the South Pole. Most of the continent lies within the Antarctic Circle, 66°33'39" south of the Equator. Geographers divide the continent into three regions: East Antarctica, West Antarctica, and the Antarctic Peninsula.
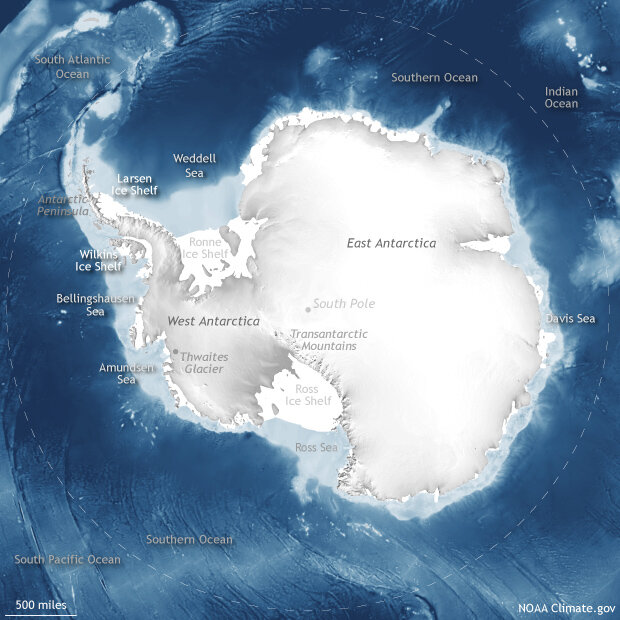
Geographers divide Antarctica into three regions: East Antarctica, West Antarctica, and the Antarctic Peninsula. The Transantarctic Mountains separate the eastern and western parts of the continent. Ice shelves fringe the continent, the two largest being the Ronne and the Ross. Among the nearby seas are the Amundsen, Bellinghausen, Davis, Ross, and Weddell, and Antarctica is surrounded by the vast Southern Ocean.
Separating East and West Antarctica, the Transantarctic Mountains include peaks over 14,000 feet, and an even higher peak—16,000+-foot Mt Vinson—rises near the Antarctic Peninsula. But mountains aren’t what make Antarctica the highest-elevation continent on Earth. Ice is. Thanks to thick ice, Antarctic elevation averages more than 6,000 feet (more than a mile above sea level). The very highest parts of the ice sheet, near the center of East Antarctica, rival the height of its tallest mountains, at nearly 13,500 feet.
The coldest, driest continent
At South Pole Station, the average monthly summer temperature is −18°F, and the average winter monthly temperature is −76°F, according to the U.S. Antarctic Program. These temperatures are much colder than the North Pole’s, which averages −40°F in winter and 32°F—right on the cusp of melting—in summer. In fact, Antarctica is home to the coldest place on Earth.
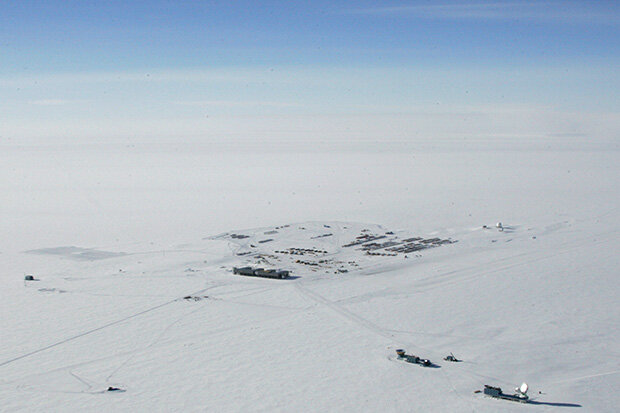
Located at the geographic South Pole, Antarctica's Amundsen-Scott research station is a tiny human outpost on a vast ice sheet that seems to stretch unbroken to the horizon. Image courtesy the National Science Foundation.
Antarctica’s interior gets so little precipitation that it counts among the world’s driest deserts. Air masses reaching the high-elevation interior are usually stripped of moisture. The U.S. Antarctic Program reports that, continent-wide, Antarctica receives an average of roughly 2 inches of precipitation per year. (Phoenix, Arizona, gets about 7.5 inches of annual precipitation.) But intense storms with hurricane-force winds near the coasts may drop heavy precipitation around the steep margins of the continent—up to 10 feet of water as snowfall! The snowiest parts of the continent are the Antarctic Peninsula and the northern coast of West Antarctica.
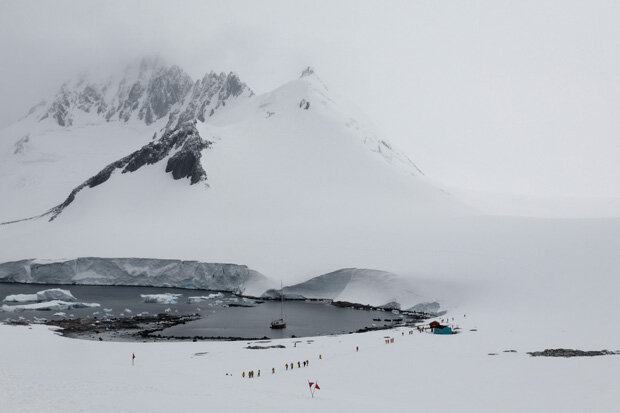
A line of tourists walking along an inlet in the Damoy Point area of the Antarctic Peninsula on January 4, 2018. Deep snow is plastered to the surrounding peaks, smoothing the rocky landscape. Only the peninsula and the northern coast of West Antarctica receive significant snowfall. The interior Antarctica is a frigid desert. Photo by Ronald Woan, used under a Creative Commons license.
Air temperature changes
Like other continents, Antarctica feels the impacts of climate change at different rates in different places. Multiple studies have reported rising temperatures in West Antarctica. A 2013 study led by David Bromwich reported a temperature increase of 4.3 ± 2.2°F over 1958–2010. A 2014 study by Bromwich and Julien Nicolas reconstructed Antarctic near-surface monthly mean temperatures from 1958–2012 and concluded that annual temperatures rose 0.40 ± 0.22°F per decade across West Antarctica, and 0.59 ± 0.31°F per decade across the Antarctic Peninsula.
Over East Antarctica, which is much higher in elevation, temperature trends have been harder to assess. The 2014 Bromwich and Nicolas study concluded that temperatures rose by 0.11 ± 0.16°F per decade between 1958–2012, but the trend was not statistically significant. At the Amundsen-Scott Station at the South Pole—located in East Antarctica—temperatures have cooled in recent decades; a 2014 review paper in Polar Record suggested that the cooling trend could be due to fewer warm ocean air masses reaching the continent’s interior.
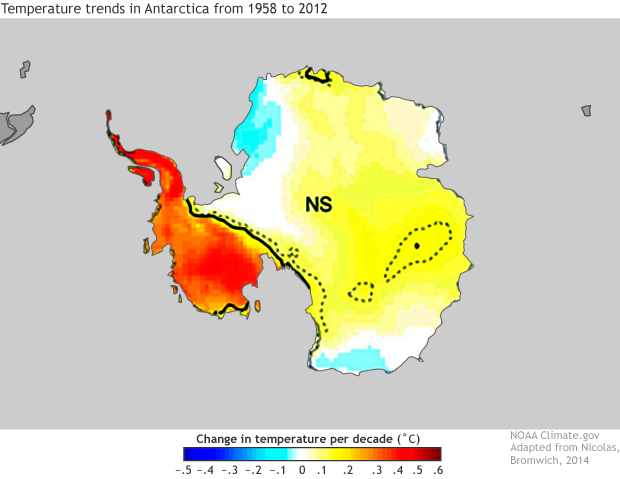
Adapted from Nicolas and Bromsich 2014, this map shows 1958–2012 year-round temperature trends in °C per decade. The thick black line delineates the area with 95% confidence (West Antarctica and the Antarctic Peninsula). NS indicates that the area east of the thick black line has confidence levels that are not statistically significant.
The Intergovernmental Panel on Climate Change (IPCC) synthesis report published in 2014 found a warming trend over Antarctica, but expressed low confidence that the warming was caused by human activities. In the late twentieth century, the ozone hole and its effects on air circulation may have partly shielded the continent from the global warming influence of greenhouse gas emissions. Continued success in addressing the ozone hole, along with fossil fuel emissions, may cause Antarctic temperatures to rise more rapidly in future decades.
The Antarctic Peninsula—lower in elevation and closer to the equator—experienced rapid temperature increases for several decades in the twentieth century. Then, in the late 1990s, temperature increases slowed, and since 2000, the Peninsula has actually cooled. Studies published in Nature and Nature Climate Change in 2016 concluded that the recent cooling can be explained by natural variability and trends in Pacific Ocean temperatures. Despite the recent cooling, the northern parts of the Antarctic Peninsula remain much warmer than they were in the middle of the last century.
Ocean warming
Although seasonal cycles and historically low sample sizes have complicated scientists’ attempts to detect long-term temperature changes in the Southern Ocean, a temperature record extending back to 1925, with frequent measurements, exists around South Georgia Island. Those measurements show a warming of 4.1°F over 81 years in the upper 500 feet of the ocean, according to a 2013 review paper in Polar Record.
Monthly average sea surface temperatures in the Southern Ocean around Antarctica from 1850–2017, based on NOAA's ERSSTv5 data set. Analysis by Climate Reanalyzer, University of Maine Climate Change Institute.
West of the Antarctic Peninsula, measurements dating back to the 1950s show a strong warming trend in the upper ocean: nearly 2.7°F. Meanwhile, waters of the Antarctic Circumpolar Current (ACC), far below the surface, have warmed faster than the rest of the global ocean. Between depths of 1,000 and 3,000 feet, ACC temperatures rose by 0.11°F per decade between the 1960s and the 2000s. Between the 1980s and 2013, ACC temperatures at those depths rose by 0.16°F per decade.
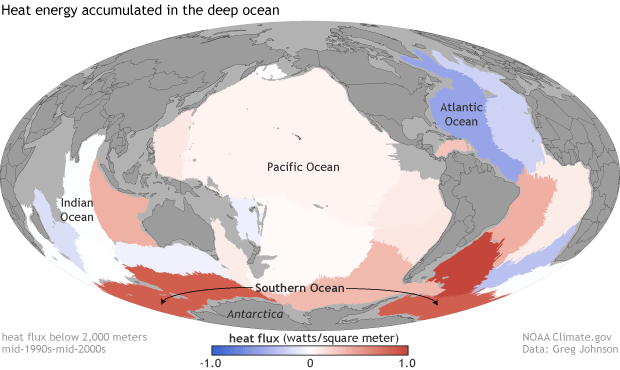
Heat flux into the deep ocean (below 2,000 meters) between the mid-1990s and the mid-2000s, based on repeat ship cruise data. Places where the deep ocean gained heat are red; places where it lost heat are blue. NOAA Climate.gov map, based on data provided by Greg Johnson.
Sea ice variability, but no long-term change
Due to basic geographic differences, Antarctic sea ice extents are smaller than the Arctic’s in summer, and larger in winter. Over 1981–2010, Antarctic sea ice has averaged over 7 million square miles at its winter maximum, usually in September, and about 1 million square miles at its summer minimum, usually in late February or early March.
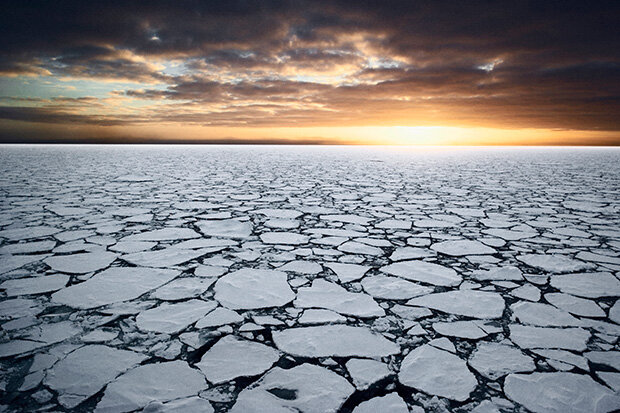
A jigsaw puzzle of floating ice extends as far as you can see in the Ross Sea on November 24, 2006. Photo by John B. Weller photo, courtesy of The Pew Charitable Trusts.
In contrast with the Arctic—where climate change is amplified, and sea ice shows a clear declining trend over time—Antarctic sea ice does not show a significant overall trend in either the summer or the winter. One region, south and west of the Antarctic Peninsula, has shown a persistent decline, but this trend is small relative to the high variability of the other Antarctic sea ice regions. In 2015, sea ice experts concluded that the small gains in Antarctic sea ice in some seasons were not enough to cancel out Arctic losses, and so globally, sea ice was declining. That basic conclusion remains true in early 2019.
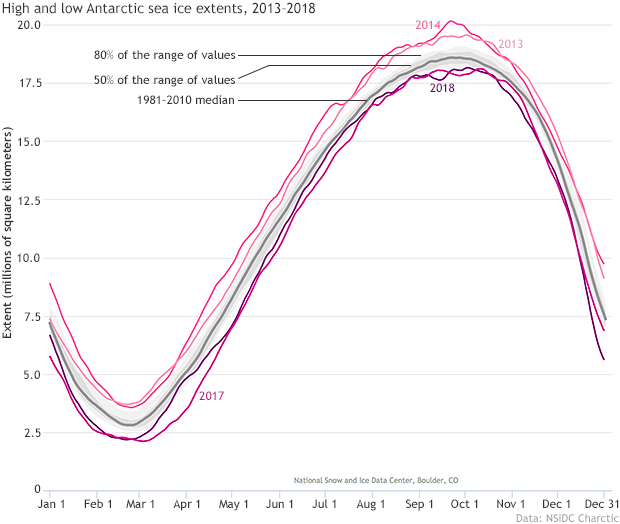
Derived from NSIDC’s Charctic tool, this graph shows the two highest and two lowest Antarctica sea ice extents in the satellite record. All have occurred within the last several years.
In just the last decade, Antarctic sea ice has exhibited the two highest maximum extents on record (2013 and 2014) and the two lowest minimum extents on record (2017 and 2018). Antarctic sea ice behavior to date appears to have more to do with natural variability, including annual and decadal cycles in the surrounding Southern Ocean, than with human-caused climate change.
Ice sheets are losing mass
Antarctic snowfall has accumulated over millions of years to build the world’s biggest ice sheet, essentially a massive glacier flowing in all directions. The Antarctic Ice Sheet extends over nearly 5.4 million square miles, and it’s about 13,000 feet thick at its summit, over the East Antarctic Plateau. The ice sheet covers virtually all of the Antarctic land area, reaching the ocean through scores of glaciers. Some glaciers terminate right at the coastline, and some extend well out over the ocean in floating shelves.
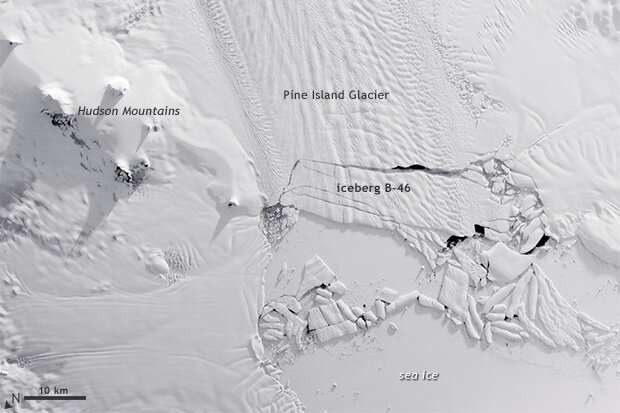
The Pine Island Glacier drains part of the West Antarctic Icesheet into the Amundesen Sea via Pine Island Bay. Recently, the glacier has been calving massive icebergs, such as this one, designated B-46, captured in a NASA satellite image from November 7, 2018. Image by NASA Earth Observatory.
Ice sheets gain mass through snowfall and, to a miniscule amount, rainfall. They lose mass in three ways: ablation (ice evaporation), iceberg calving, and melting, either on the surface or from the underside of ice shelves that are in contact with the ocean. When average annual ice loss through melt and other means is equaled by snowfall, the ice sheet is in balance. Otherwise, the ice sheet either gains or loses mass.
Its sheer size makes precise measurement of mass changes in the Antarctic ice sheet difficult because at present, those changes are small relative to the ice sheet’s natural gains and losses each year. Until very recently, the consensus view has been that ice sheets across West Antarctica and the Antarctic Peninsula are losing mass, while East Antarctica has been relatively stable or even gaining mass. For instance, a 2012 Science study led by Andrew Shepherd reconciled different estimates—from models, mass-budget calculations, elevation changes, and satellite-based gravity measurements—and concluded that East Antarctica gained 14 ± 43 gigatons of ice over 1992–2011, West Antarctica lost 65 ± 26 gigatons, and the Antarctic Peninsula lost 20 ± 14 gigatons.
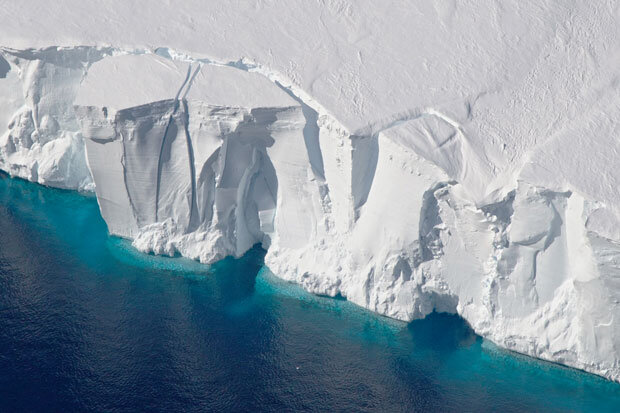
An aerial photo of the Getz Glacier ice shelf front on November 5, 2016, reveals water so clear that you can see some underwater portions of the ice shelf, including two cavities being hollowed out near the water line. NASA Operation Ice Bridge photo.
The east-west difference in ice sheet changes was confirmed in a 2018 Nature study by the Ice Sheet Mass Balance Inter-comparison Exercise (IMBIE) team. The group of 80 polar scientists concluded that from 1992–2017, ocean melting and ice-shelf collapse caused the Antarctic Peninsula and West Antarctica to lose ice at increasing rates: accelerating from 53 ± 29 gigatons to 159 ± 26 gigatons per year in West Antarctica over the period, and from 7 ± 13 gigatons to 33 ± 16 gigatons per year on the Antarctic Peninsula. The authors were less certain of the rate of change in East Antarctica, but estimated that it had gained 5 ± 46 gigatons per year over 1992–2017.
A paper published in the Proceedings of the National Academy of Sciences (PNAS) in early 2019, however, challenged the consensus of West Antarctic losses and East Antarctic gains. Using newer data sources and an adjusted model for overall ice accumulation, the new study, led by Eric Rignot, examined ice mass changes over 1979–2017. He and his colleagues concluded that the rate of ice mass loss across the entire continent increased over each decade studied: 40 ± 9 gigatons per year in 1979–1990, 50 ± 14 gigatons per year in 1989–2000, 166 ± 18 gigatons per year in 1999–2009, and 252 ± 26 gigatons per year in 2009–2017. This study found mass loss in from all Antarctic ice sheets over 2009–2017. The authors concluded, “East Antarctica is a major participant in the mass loss.” However, these newer figures have not yet been corroborated by satellite observations of gravity and elevation changes.
Ice shelves destabilizing
An ice shelf is a thick slab of floating ice, attached and grounded along a coastline and extending over the ocean water. In total, Antarctica has 15 major ice shelves, most of them fed by glaciers growing slowly outward toward the open ocean. Most of the time, an ice shelf and the glaciers feeding it form a relatively stable system, with flow from the glacier resisted by the ice shelf’s connection to the coastline or island obstructions that poke up into it. Every so often, an ice shelf breaks off a large piece, forming an iceberg, which in Antarctica, may rival the size of a small U.S. state. Iceberg calving is a natural process. A more recent and unusual phenomenon is ice shelf disintegration.
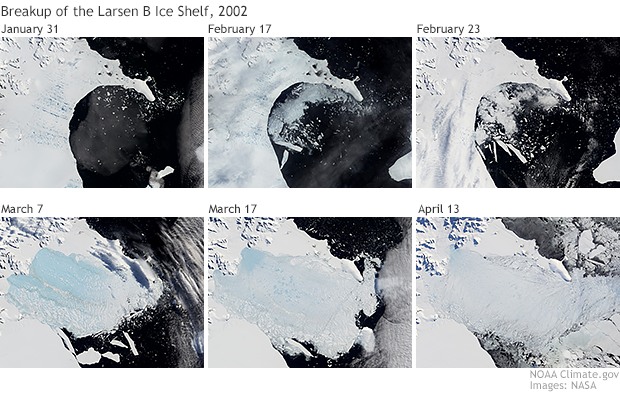
Between late January and mid-April 2002, roughly 1,250 square miles of the Larsen B Ice Shelf on the eastern side of the Antarctic Peninsula disintegrated. Images from NASA.
On the eastern side of the Antarctica Peninsula, the Larsen Ice Shelf experienced its first satellite-observed disintegration in 1995. Roughly 580 square miles rapidly disintegrated into small, sliver-shaped icebergs. In 2002, the Larsen Ice Shelf experienced a bigger disintegration: about 1,250 square miles over the course of several weeks. On the western side of the peninsula, the Wilkins Ice Shelf also underwent a series of disintegration events starting in 1998. Though smaller in scale than the Larsen breakups, the Wilkins events were significant for their rapidity, including a miles-long retreat in a single day.
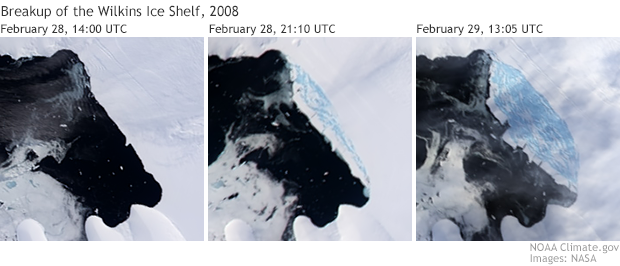
In late February 2008, the Wilkins Ice Shelf on the western side of the Antarctic Peninsula retreated several miles in a single day. Images from NASA.
Multiple factors likely contribute to ice shelf disintegration. Warm summers can cause a layer of meltwater to form on the ice shelf surface. If the ice surface has cracks—and it often does due to the ice’s movement and deformation over time—water fills those cracks. Because it’s denser than ice, the water eventually slices through the ice, carving it into smaller pieces. And as warm air temperatures can melt ice shelves from above, warm ocean water can thin the ice shelf from below, making it more vulnerable to disintegration. Finally, sea ice floating in front of the ice shelf dampens wave action, but where sea ice retreats completely in late summer, ocean waves can flex an ice shelf and make it more vulnerable to breakup.
By itself, an ice shelf disintegration doesn’t immediately raise ocean level. The slab of ice was already floating on the ocean surface, taking up roughly the same amount of space as it would when it melts. But ice shelf retreat can cause sea level rise indirectly by allowing the glaciers that fed the shelf to speed up.
Glacier acceleration
A key feature of the glacier-ice shelf system is the grounding line: the point where the ice shelf lifts off the bedrock and starts to float on the ocean surface. The location and shape of the grounding line depends on the underlying bedrock elevation. Although the ice sheet hides Antarctica’s topography from view, its bedrock elevation ranges from thousands of feet above to thousands of feet below sea level, with below-sea-level rock being more common in West Antarctica.
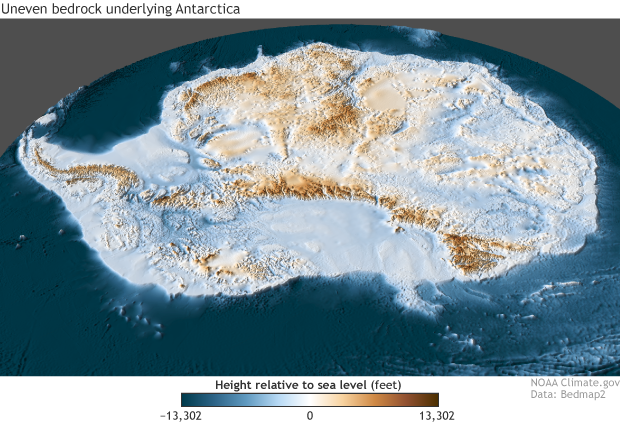
Antarctic ice sheets overlie surprisingly uneven bedrock above (brown) and below (blue) sea level. The Transantarctic Mountains and parts of the Antarctic Peninsula rise far above sea level, but large expanses across East and West Antarctica lie below sea level. Image derived from Bedmap2 data from the British Antarctic Survey.
Sometimes an ice shelf’s grounding line occurs along an ice rise, an isolated high point in the bedrock, and behind the ice rise, the bedrock slopes downhill to well below sea level. When the ice shelf retreats past the ice rise, warm ocean water can quickly infiltrate the area, and rapidly melt the ice shelf from below.
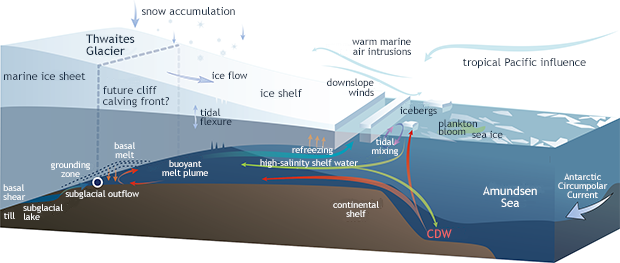
Glacier-fed ice shelves are complex systems affected by multiple factors: gravity pulling on the glacier, water buoying the ice shelf, air and water temperatures, winds, storms, snow accumulation and so on. Atmospheric and oceanic circulation patterns can drive these events, and ice shelf responses can change the outcome. This schematic of Thwaites Glacier in West Antarctica shows some of the processes affecting glacier flow and ice shelf calving. Image from Scambos et al. 2017.
Whenever a glacier-fed ice shelf retreats past any grounding line, there isn’t much left to slow the glacier’s flow. In the 18 months following the Larsen B Ice Shelf disintegration, glaciers feeding that ice shelf accelerated between three and eight times their original speed. Subsequent observations continued finding accelerated flow years later. Accelerated glacier flow does have implications for sea level because it introduces ice that was held above sea level and on land into the ocean, adding volume to the ocean that hadn’t been there before.
Antarctica’s role in sea level rise
Right now, Antarctica’s contribution to sea level rise can be measured in millimeters. On the Antarctic Peninsula, where ice shelf collapses have led to measurable glacier acceleration, the effect on sea level is currently just a tenth of a millimeter—about the width of a human hair. But if glaciers draining the West and East Antarctic Ice Shelves begin to accelerate, the effect on global sea level could be significant. A joint United States-United Kingdom project to study Thwaites Glacier in West Antarctica is driven by the possibility that this Florida-sized glacier, which is already thinning rapidly, might collapse. The nearby Pine Island Glacier is flowing about 60 percent faster than it did in the 1970s, and also poses a potential hazard to coastal communities.
Ted Scambos, a research scientist at the University of Colorado, snapped this photo of the lower Thwaites Glacier on November 9, 2016. This glacier's potential collapse has spurred a joint United States-United Kingdom research project.
If the entire Antarctic Ice Sheet were to melt at once, it would raise global sea level more than 180 feet. Outside of an epic natural disaster such as an asteroid slamming into Antarctica, that ice sheet isn’t going to melt entirely for centuries, but it will contribute to sea level rise over the next century. The question is: How much? The exact answer is elusive. The IPCC Fifth Assessment Report (AR5) states that the effect of Antarctic ice sheets on sea level rise over the coming century is a major unknown. Not only is the ice sheet melt rate challenging to measure precisely, but other events could accelerate sea level rise, and it’s hard to know when or even if those events will occur.
The biggest projections of 21st-century sea level rise are driven by a phenomenon known as marine ice cliff instability (MICI). The hypothesized scenario is that, when an ice shelf retreats to a point where an ice cliff rises some 300 feet above the sea surface, that cliff is so unstable that its front is prone to topple—leading to a taller, even more unstable ice cliff and a runaway process of ice loss. A 2016 study by DeConto and Pollard argued that this process could contribute over three feet to sea level rise by the year 2100. However, the evidence for this process is indirect, such as an absence of any observed ice cliffs exceeding that height. A 2019 study led by Tamsin Edwards found that MICI wasn’t needed to reproduce Antarctica-driven sea level changes that happened within the past few million years, and might not occur in the foreseeable future.
Another process that could accelerate ice loss is warm-water-driven melt on the underside of the ice. As the ice thins, warm water can reach further inland, thinning the glacier especially quickly in places where the bedrock is below sea level. A 2019 study led by Nicholas Golledge stated that warm-ocean-driven melt from Antarctica and Greenland combined could contribute up to 10 inches to global sea level by the year 2100. Antarctica is expected to respond slowly to underside melt at first, with an accelerating response later in the century. The authors stated that the ice-acceleration tipping point may have already been reached for parts of the West Antarctic Ice Sheet.
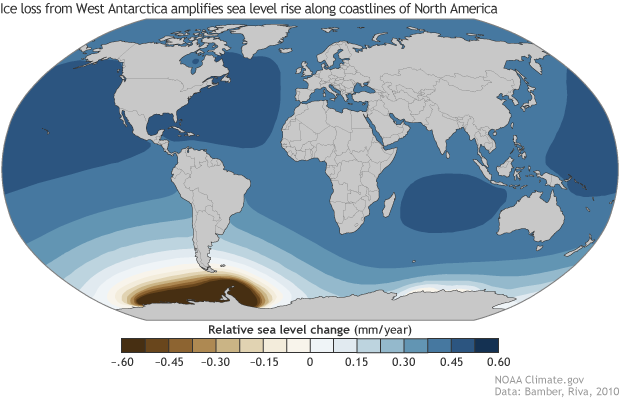
The gravitational pull of land and ice affects regional sea levels. A substantial loss of Antarctic ice would actually drop sea levels around Antarctica, and raise sea levels to a greater degree in parts of the Northern Hemisphere. This map shows projected sea level rise if Antarctica loses 135 gigatons of ice per year. Blue corresponds to higher ocean levels and brown corresponds to lower sea levels. Image adapted from Bamber and Riva 2010.
Simulations of future sea level rise highlight something regionally important: the sea level rise from a melting ice sheet won’t necessarily be shared equally around the globe. Antarctic ice sheets are so massive that they exert a gravitational pull on the surrounding ocean, drawing local sea levels up higher onto the continent’s shores. The loss of mass from a melting ice sheet is projected to cause local sea level to fall. Meanwhile, shorelines farther from the Antarctic Ice Sheet would see a relative rise in gravitational pull, and a corresponding rise in sea level. Among the regions projected to experience rapid sea level rise resulting from Antarctic Ice Sheet loss are the U.S. Eastern Seaboard and the Gulf of Mexico.
References
About the Continent. United States Antarctic Program. Accessed January 30, 2019.
Bamber, J., Riva, R. (2010). The sea level fingerprint of recent ice mass fluxes. The Cryosphere, 4, 621–627. doi:10.5194/tc-4-621-2010.
Bromwich, D.H., Nicolas, J.P., Monaghan, A.J., Lazzara, M.A., Keller, L.M., Weidner, G.A., Wilson, A.B. (2013). Central West Antarctica among the most rapidly warming regions on Earth. Nature Geoscience, 6, 139–145. doi:10.1038/ngeo1671.
Charctic Interactive Sea Ice Graph. National Snow and Ice Data Center. Accessed January 23, 2019.
Coldest Place on Earth is Colder than Scientists Thought. (2018, June 25). American Geophysical Union. Accessed January 31, 2019.
DeConto, R.M., and D. Pollard. (2016). Contribution of Antarctica to past and future sea-level rise. Nature, 531, 591–597. doi:10.1038/nature17145
Discovering Antarctica. British Antarctic Survey. Accessed January 30, 2019.
Edwards, T.L., Brandon, M.A., Durand, G., Edwards, N.R., Golledge, N.R., Holden, P.B., Nias, I.J., Payne, A.J., Ritz, C., Wernecke, A. (2019). Revising Antarctic ice loss due to marine ice-cliff instability. Nature, 566, 58–64. doi:10.1038/s41586-019-0901-4.
Fretwell, P., Pritchard, H.D., Vaughan, D.G., Bamber, J.L., Barrand, N.E., Bell, R., Bianchi, C., Bingham, R.G., Blankenship, D.D., Casassa, G., Catania, G., Callens, D., Conway, H., Cook, A.J., Corr, H.F.J., Damaske, D., Damm, V., Ferraccioli, F., Forsberg, R., Fujita, S., Gim, Y., Gogineni, P., Griggs, J.A., Hindmarsh, R.C.A., Holmlund, P., Holt, J.W., Jacobel, R.W., Jenkins, A., Jokat, W., Jordan, T., King, E.C., Kohler, J., Krabill, W., Riger-Kusk, M., Langley, K.A., Leitchenkov, G., Leuschen, C., Luyendyk, B.P., Matsuoka, K., Mouginot, J., Nitsche, F.O., Nogi, Y., Nost, O.A., Popov, S. V., Rignot, E., Rippin, D.M., Rivera, A., Roberts, J., Ross, N., Siegert, M.J., Smith, A.M., Steinhage, D., Studinger, M., Sun, B., Tinto, B.K., Welch, B.C., Wilson, D., Young, D.A., Xiangbin, C., Zirizzotti, A. (2013). Bedmap2: improved ice bed, surface and thickness datasets for Antarctica. The Cryosphere, 7, 375–393. doi:10.5194/tc-7-375-2013.
Golledge, N.R., Keller, E.D., Gomez, N., Naughten, K.A., Bernales, J., Trusel, L.D., Edwards, T.L. (2019). Global environmental consequences of twenty-first-century ice-sheet melt. Nature, 566, 65–72. doi:10.1038/s41586-019-0889-9.
Hale, G. (2014, November 19). East and West: The Geography of Antarctica. NASA Operation IceBridge. Accessed January 23, 2019.
Ice Bridge Supporting Wilkins Ice Shelf Collapses. (2009, April 8). National Snow and Ice Data Center. Accessed February 24, 2019.
IMBIE Team. (2018). Mass balance of the Antarctic Ice Sheet from 1992 to 2017. Nature, 558, 219–222. doi:10.1038/s41586-018-0179-y.
Intergovernmental Panel on Climate Change. (2014). Climate Change 2014: Synthesis Report. Contribution of Working Groups I, II and III to the Fifth Assessment Report of the Intergovernmental Panel on Climate Change [Core Writing Team, R.K. Pachauri and L.A. Meyer (eds.)]. IPCC, Geneva, Switzerland.
Jones, J.M., Gille, S.T. Goosse, H., Abram, N.J., Canziani, P.O., Charman, D.J., Clem, K.R., Crosta, X., de Lavergne, C., Eisenman, I., England, M.H., Fogt, R.L., Frankcombe, L.M., Marshall, G.J., Masson-Delmotte, V., Morrison, A.K., Orsi, A.J., Raphael, M.N., Renwick, J.A., Schneider, D.P., Simpkins, G.R., Steig, E.J., Stenni, B., Swingedouw, D., Vance, T.R. (2016). Assessing recent trends in high-latitude Southern Hemisphere surface climate. Nature Climate Change, 6, 917–926. doi:10.1038/nclimate3103.
Kopp, R.E., DeConto, R.M., Bader, D.A., Hey, C.C., Horton, R.M., Kulp, S., Oppenheimer, M., Pollard, D., Strauss, B.H. (2017). Evolving understanding of Antarctic ice‐sheet physics and ambiguity in probabilistic sea‐level projections. Earth’s Future. 5, 1217–1233. doi:10.1002/2017EF000663.
Muto, A. 2010. Multi-decadal surface temperature trends in East Antarctica inferred from borehole firn temperature measurements and geophysical inverse methods. Geography Graduate Theses and Dissertations. 11.
Nicolas, J.P., Bromwich, D.H. (2014). New reconstruction of Antarctic near-surface temperatures: Multidecadal trends and reliability of global reanalyses. Journal of Climate, 27, 8070–8093. doi:10.1175/JCLI-D-13-00733.1.
Polar Discovery. Woods Hole Oceanographic Institution. Accessed January 30, 2019.
Rignot, E., Mouginot, J., Scheuchl, B., van den Broeke, M., van Wessem, M., Morlighem, M. (2019). Four decades of Antarctic Ice Sheet mass balance from 1979–2017. PNAS, 116(4), 1095–1103. doi:10.1073/pnas.1812883116.
Scambos, T.A., Bell, R.E., Alley, R.B., Anandakrishnan, S., Bromwich, D.H., Brunt, K., Christianson, K., Creyts, T., Das, S.B., DeConto, R., Dutrieux, P., Fricker, H.A., Holland, D., MacGregor, J., Medley, B., Nicolas, J.P., Pollard, D., Siegfried, M.R., Smith, A.M., Steig, E.J., Trusel, L.D., Vaughan, D.G., Yager, P.L. (2017). How much, how fast?: A science review and outlook for research on the instability of Antarctica’s Thwaites Glacier in the 21st century. Global and Planetary Change, 153, 16–34. doi:10.1016/j.gloplacha.2017.04.008.
Scambos, T.A., Campbell, G.G., Pope, A., Taran, T., Muto, A., Lazzara, M., Reijmer, C.H., van den Broeke, M.R. (2018). Ultralow surface temperatures in East Antarctica from satellite thermal infrared mapping: The coldest places on Earth. Geophysical Research Letters, 45, 6124–6133. doi:10.1029/2018GL078133.
Scambos, T., Stammerjohn, S. (2018). Ocean heat content [in State of the Climate in 2017]. Bulletin of the American Meteorological Society, 99(8), S175–S192.
Shepherd, A., Ivins, E.R., A, G., Barletta, V.R., Bentley, M.J., Bettadpur, S., Briggs, K.H., Bromwich, D.H., Forsberg, R., Galin, N., Horwath, M., Jacobs, S., Joughin, I., King, M.A., Lenaerts J.T.M., Li, J., Ligtenberg, S.R.M., Luckman, A., Luthcke S.B., McMillan, M., Meister, R., Milne, G., Mouginot, J., Muir, A., Nicolas, J.P., Paden, J., Payne, A.J., Pritchard, H., Rignot, E., Rott, H., Sørensen, L.S., Scambos, T.A., Scheuchl, B., Schrama, E.J.O., Smith, B., Sundal, A.V., van Angelen, J.H., van de Berg, W.J., van den Broeke, M.R., Vaughan, D.G., Velicogna, I., Wahr, J., Whitehouse, P.L., Wingham, D.J., Yi, D., Young, D., Zwally, H.J. (2012). A reconciled estimate of ice-sheet mass balance. Science, 338(6111), 1183–1189. doi:10.1126/science.1228102.
State of the Cryosphere. National Snow and Ice Data Center. Accessed January 23, 2019.
Turner, J., Barrand, N., Bracegirdle, T., Convey, P., Hodgson, D.A., Jarvis, M., Jenkins, A., Marshall, G., Meredith, M.P., Roscoe, H., Shanklin, J., French, J., Goosse, H., Guglielmin, M., Gu , J., Jacobs, S., Kennicu , M.C., Masson-Delmotte, V., Mayewski, P., Navarro, F., Robinson, S.A., Scambos, T., Sparrow, M., Summerhayes, C., Speer, K, Klepikov, A. (2014). Antarctic climate change and the environment: An update. Polar Record, 50 (3), 237–259. doi:10.1017/s0032247413000296.
Turner, J., Lu, H., White, I., King, J.C., Phillips, T., Hosking, J.S., Bracegirdle, T.J., Marshall, G.J., Mulvaney, R., Deb, P. (2016). Absence of 21st century warming on Antarctic Peninsula consistent with natural variability. Nature, 535, 411–415. doi:10.1038/nature18645.
Western Regional Climate Center. Arizona Climate Summaries. Accessed February 16, 2019.