April 2021 outlook: Warmth expected for much of the contiguous US…except you, Pacific Northwest
Spring across the United States is prime weather-whiplash season. One day it could be sunny and 75° F. The next, it might be snowing. But on a monthly timescale, what is favored for April 2021? The April 2021 outlook from NOAA’s Climate Prediction Center predicts a tilt in the odds towards warmer-than-average temperatures across much of the contiguous United States and drier-than-average conditions across the southern tier.
A reminder: the climate outlook maps are not a forecast for the absolute temperature or precipitation amounts in April. Instead, they are the probability (percent chance) that April temperatures or precipitation will be in the upper, middle, or lower third of the climatological record (1981-2010) for April. (Note: the climatological record will shift to 1991-2020 later this year). We refer to these categories as “well above” and “well below” average. The colors (red or blue for temperatures, brown or teal for precipitation) indicate which outcome is the most likely. Darker colors reflect higher chances of a given outcome; not more extreme conditions. Head to the end of this post for more on the math behind the outlooks.
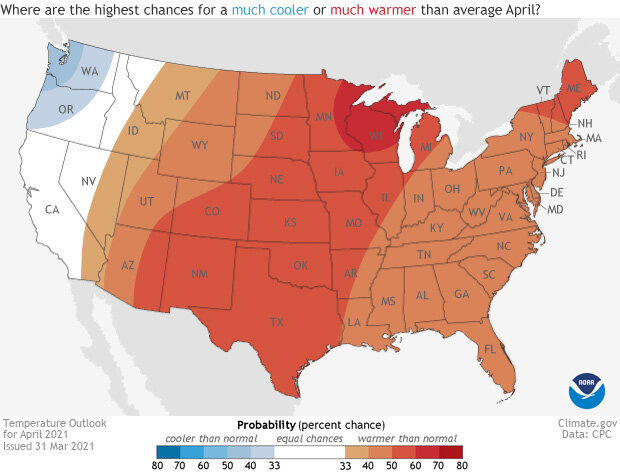
Places in the Lower 48 states where the forecast odds for April 2021 favor a much colder than usual April (blue colors) or much warmer than usual April (red), or where the probability of a cold April, a warm April, or a near-normal April are all equal (white). The darker the color, the stronger the chance of that outcome (not the bigger the departure from average). NOAA Climate.gov map, based on forecast data from NOAA CPC.
Lots of warmth except in the Pacific Northwest
Like the outlook last month, the Climate Prediction Center’s April forecast favors temperatures to lean on the warmer-than-average side for the vast majority of the contiguous United States. The highest likelihood for a warmer-than-average April is over the western Great Lakes (60-70%), though the entire Plains has over a 50% chance (50-60%) of observing above-average monthly temperatures.
The only area of the Lower 48 forecast to see odds tilted to below-average temperatures are across the Pacific Northwest (though the southern half of Alaska also has the same colder-than-average forecast).
Normally when forecasters are discussing the influences on the monthly outlook, phrases like ENSO, Arctic Oscillation, and the MJO are thrown around. But one influence you might not think about is how much moisture is in the soil. In places with dry soil (a soil moisture deficit), temperatures could be even hotter as less energy can be “diverted” from heating to evaporating water from the soil. The opposite holds true, too. Wet soil can tamp down temperatures. In April, the large soil moisture deficits over the West, especially the Southwest, are part of the reason the forecast favors above-average monthly temperatures.
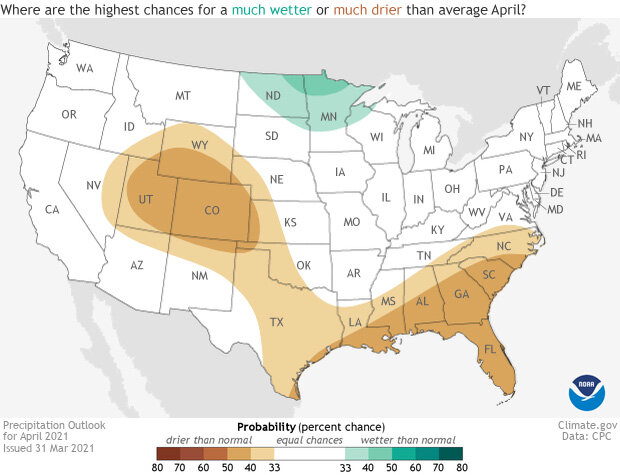
Places in the Lower 48 states where the forecast odds for April 2021 favor a much wetter than usual April (green colors) or much drier than usual April (brown), or where the probability of a wet April, a dry April, or a near-normal April are all equal (white). The darker the color, the stronger the chance of that outcome (not the bigger the departure from average). NOAA Climate.gov map, based on forecast data from NOAA CPC.
Drier-than-average conditions favored parts of the southern United States
For the Gulf Coast, the signal in April is similar to what’s common when a La Niña is occurring in the Pacific. And that signal is a dry one. The tilt in the odds towards a drier-than-average month extend from the Southeast towards the western Plains and Rocky Mountains. This means that once again the forecast favors less precipitation than usual across a region of the country—the Southwest and West—locked in an extended and deep drought.
The one area in the contiguous United States where April precipitation tilts towards wetter than average is across North Dakota, Minnesota, and Wisconsin. Western Alaska also is favored to observe a wetter-than-average April.
While these climate forecasts are monthly, what happens with the weather during the first couple of weeks can have a large impact on the monthly averages. For instance, in northern California, southern Oregon, western Nevada, and western Idaho, the forecast for the first ten days of April is for near-average precipitation. After that the precipitation signal gets muddled. But because of that expected precipitation during the beginning of the month, the likelihood for a below-average precipitation month was decreased compared to the April outlook made in the middle of the March.
Dry, dry, dry, dry, dry, dry, dry
Nearly 44% of the country is currently in some form of drought with nearly 9% in the worst drought category, D4-exceptional drought. The epicenter of that drought is located across the Southwest stretching from the Mexican border north through Utah and Colorado. But drought is pretty much present across the entire West and northern Plains.
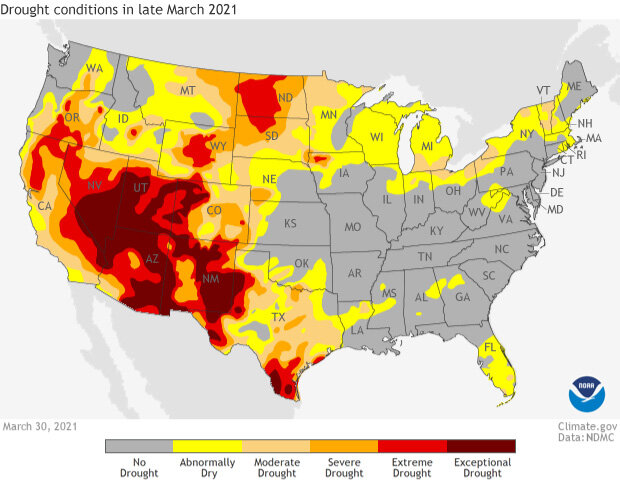
Drought conditions as of March 30, 2021, across the contiguous United States. severe (orange) and extreme (red) drought conditions were widespread across the West. NOAA Climate.gov image from the Data Snapshots collection, based on data from the U.S. Drought Monitor project.
And the next month’s forecast provides little relief. In fact, the drought outlook for April has drought expanding in Texas, Colorado, and Kansas, as well as drought developing across Florida and the Northeast. However, the wet forecast for Minnesota and North Dakota is expected to help improve drought conditions there.
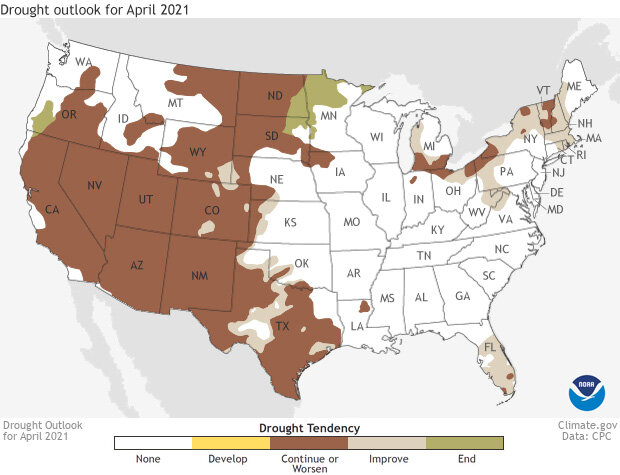
This map shows experts' assessment of how drought conditions are likely to change throughout April 2021. Dark brown areas, such as those covering much of the West, show where drought conditions are likely to persist or worsen, while tan areas show where drought is likely to improve, but not end. Gold shows areas where drought is likely to emerge, while green shows where drought is forecast to end. NOAA Climate.gov Data Snapshots image, based on data from NOAA Climate Prediction Center.
To read the entire discussion of the monthly climate outlooks from the Climate Prediction Center, check out their website. And head back to Climate.gov later this month for a United States and global climate recap of March 2021.