On average, July 2020 was relatively warm and wet across the United States
Nationally speaking, the hottest month of the year—July—is now behind us here in the United States. According to the monthly summary from NOAA’s National Centers for Environmental Information, July 2020 was a warm one, with monthly average temperature for the Lower 48 states more than 2 degrees Fahrenheit warmer than the twentieth-century average.
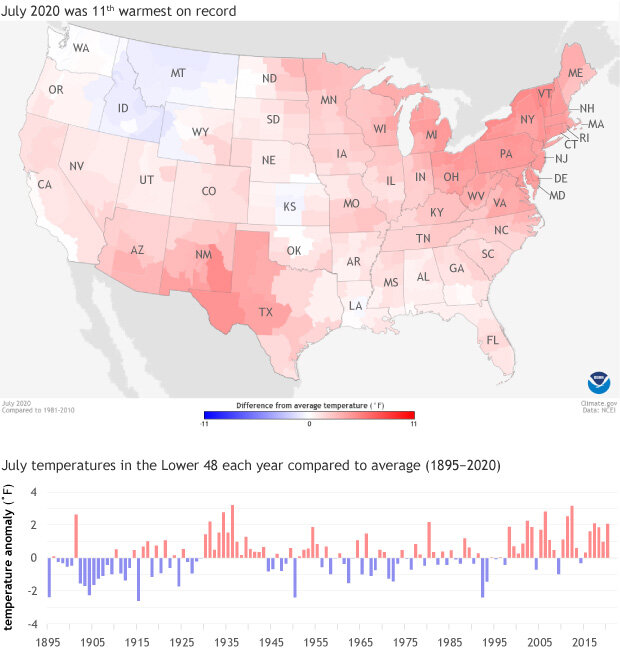
(top) July temperatures compared to the 1981-2010 average for U.S. climate divisions. Blue shows divisions with below-average temperatures, while red shows divisions with above-average temperatures. (bottom) July temperatures compared to the twentieth-century average each year from 1895-2020. Warm years are in red, and cool years are in blue. NOAA Climate.gov, based on NCEI data.
This map shows July 2020 temperatures for each U.S. climate division compared to the recent (1981-2010) average. Several parts of the Southwest, Mid-Atlantic, and Northeast were much warmer than average, with more moderate warmth across much of the West and Mississippi River Valley. Only parts of the Northern Rockies and central Great Plains experienced cooler-than-average July temperatures.
July 2020 ranked as the 11th warmest in the 126-year record, and this near-top-ten finish is in keeping with the long-term warming trend. As the graph below the map shows, a cooler-than-average July has become rare in recent decades. (July is not, however, the fast-warming month in the contiguous United States: that award goes to February, which has warmed by 4 degrees F over the 126-year record.)
On the rainfall front, July tilted toward the wet end of the U.S. climate spectrum, ranking in the wettest third of the 126-year record. Nationally averaged precipitation across the contiguous United States was 2.93 inches, which is about 5% above average for July. A wide swath of wetter than average conditions occupied the center of the country from the Northern Plains and Great Lakes southward to the Gulf of Mexico.
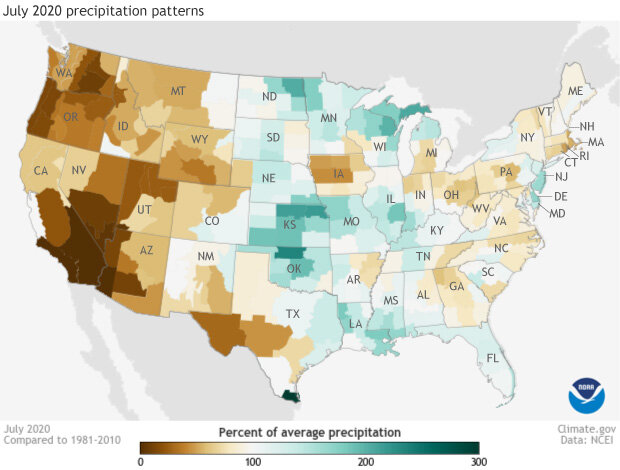
Precipitation across the United States as a percent of the 1981-2010 average. Places that had less than 100% of their average precipitation are in shades of brown; places where precipitation was 100-300% of average are in shades of blue-green. NOAA Climate.gov map from our Data Snapshots collection, based on NCEI climate division data
As usually happens with rainfall, the national-average wetness glosses over some significant regional dryness. Much of the central Rocky Mountains and the Southwest were much below average, and even record-dry in places—bad news for the region’s ongoing drought. Several smaller pockets of much below average precipitation occurred in Ohio, the northern panhandle of West Virginia, and Pennsylvania; and across the Southeast seaboard.
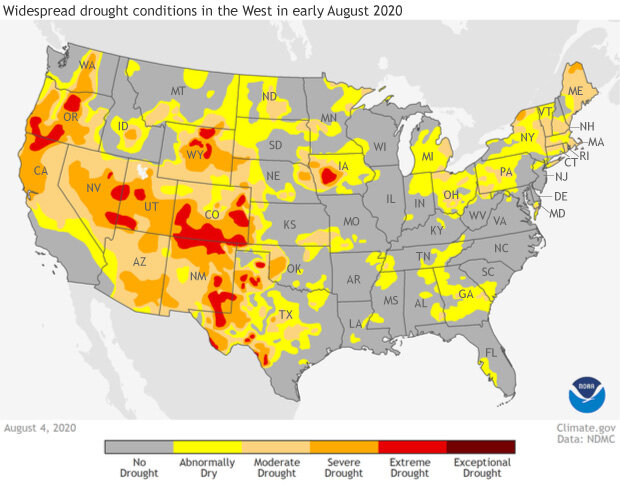
Drought conditions across the United States as of August 4, 2020. Drought conditions across much of the West range from moderate (light orange) to extreme (red). NOAA Climate.gov map from our Data Snapshots collection, based on U.S. Drought Monitor Project data.
According to the U.S. Drought Monitor project, severe and extreme drought conditions are often associated with extreme and extended fire seasons and in Colorado, California, New Mexico, and Oregon. Natural forage for livestock and wild grazing animals becomes scarce, and surface water supplies dwindle, affecting municipal, agricultural, and ecological water supplies. Unfortunately, the August climate outlook indicates continuing dry conditions are likely across much of the area.