February 2021 outlook: A winter’s chill forecast across central and western United States
February is smack dab in the middle of winter, which for snow lovers means hoping for cold and wet conditions. So what does the February 2021outlook from NOAA’s Climate Prediction Center show? Well, some hope? Colder and wetter-than-average conditions are favored across the north-central United States, with the wet signal also extended towards the East, and the cold signal extended west. Compared to previous monthly outlooks where warmth was favored, the February forecast is actually one where cold is likely to dominate.
A reminder: the climate outlook maps are not a forecast for the absolute temperature or precipitation amounts in February. Instead, they are the probability (percent chance) that February temperatures or precipitation will be in the upper, middle, or lower third of the climatological record (1981-2010) for February (note: the climatological record will shift to 1991-2020 later this year). We refer to these categories as “well above” and “well below” average. The colors (red or blue for temperatures, brown or teal for precipitation) indicate which outcome is the most likely. Darker colors reflect higher chances of a given outcome; not more extreme conditions. Head to the end of this post for more on the math behind the outlooks.
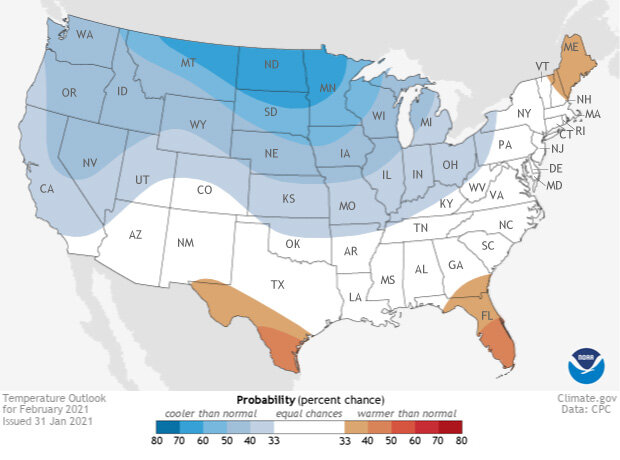
Places in the Lower 48 states where the forecast odds for February 2021 favor a much colder than usual February (blue colors) or much warmer than usual February (red), or where the probability of a cold February, a warm February, or a near-normal February are all equal (white). The darker the color, the stronger the chance of that outcome (not the bigger the departure from average). NOAA Climate.gov map, based on forecast data from NOAA CPC.
Is that blue I see?
Usually, the section on the temperature outlook involves a lot of conversation about warmer-than-average favored temperatures. However, this month flips the script. There is a tilt in the odds towards a colder-than-average February across much of the contiguous United States, stretching from the West Coast across the northern/central Plains and into the Great Lakes. The highest likelihood for below-average February temperatures (60-70%) is across the far northern plains in Minnesota, North Dakota, and Montana.
But if you’re looking for a place that might see a warmer-than-average month, your best bet is to head to southern Texas, Florida, or Maine. Though the actual temperatures in south Texas or Florida will likely be just a tiiinnnyyy bit warmer than Maine.
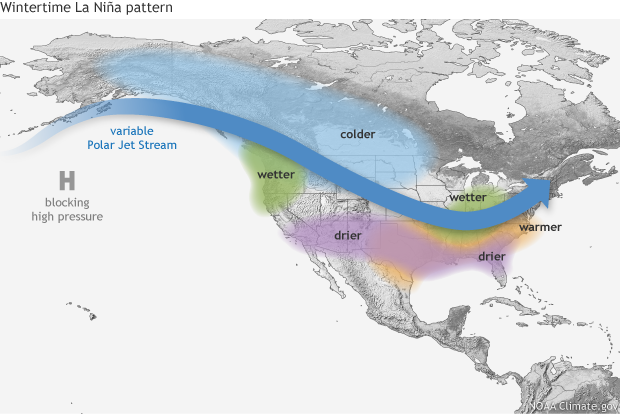
Typical impacts of La Niña on U.S. winter temperature and precipitation. Such impacts have been associated with past episodes, but all impacts aren't seen with every episode. NOAA Climate.gov drawing by Fiona Martin.
The cause, or really causes, of this widespread cold monthly forecast is (1) a predicted atmospheric configuration which allows for plenty of cold air to repeatedly be funneled down into the lower 48, (2) the influences from the ongoing La Niña in the Pacific Ocean and (3) residual affects from the weakening stratospheric Polar Vortex in January. Of course, these three reasons are not independent. Instead, each are interacting and influencing each other like three different colored food dyes swirling in a glass of water.
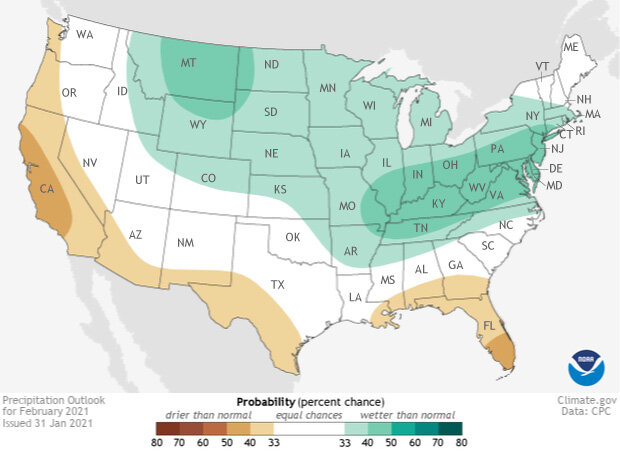
Places in the Lower 48 states where the forecast odds for February 2021 favor a much wetter than usual February (green colors) or much drier than usual February (brown), or where the probability of a wet February, a dry February, or a near-normal February are all equal (white). The darker the color, the stronger the chance of that outcome (not the bigger the departure from average). NOAA Climate.gov map, based on forecast data from NOAA CPC.
Wetter-than-average conditions favored for much of the country
A wetter-than-average February is favored for much of the contiguous United States, though areas along the West Coast that received an abundant amount of precipitation lately are favored to return to drier times.
A broad swath of the northern and eastern United States is slightly favored to observe an above-average amount of precipitation during the next month. This area stretches from the northern Rocky Mountains in Idaho and Montana, across the central Plains, into the Mississippi Valley, and on to the East Coast, including the Mid-Atlantic and New England. The highest likelihood (40-50% chance) is located across Montana, the Ohio and Tennessee Valley, and the Northeast.
Meanwhile, across the far southern tier of the United States in Florida, the Gulf Coast, Texas, the Southwest, and the West Coast, a drier-than-average February is favored.
This precipitation pattern with a wet north and dry south reflects what would be expected during a La Niña winter. In fact, you can even tell where the track of most storms is expected to be by following that area of higher odds of wetter-than-average monthly precipitation totals across the Ohio and Tennessee Valleys into the Northeast.
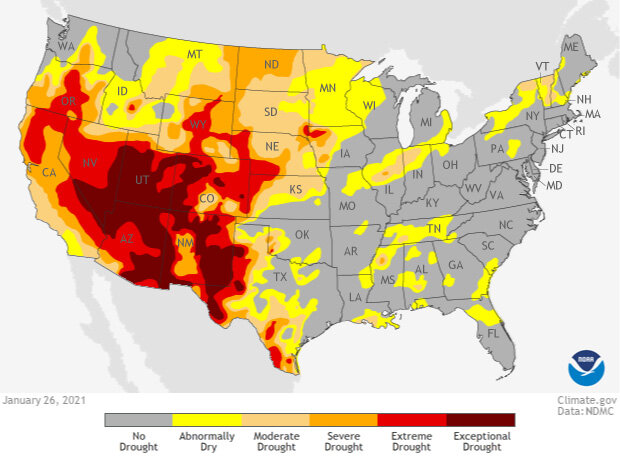
Drought conditions as of January 26, 2021, across the contiguous United States. severe (orange) and extreme (red) drought conditions were widespread across the West. NOAA Climate.gov image from the Data Snapshots collection, based on data from the U.S. Drought Monitor project.
Drought improvement in the west, drought development across the south
The impact of a good deal of moisture falling in central and northern California is the expected drought improvement across the same region during February. In fact, parts of the central coast of California could even see drought removal. That’s even with a forecast for a tilt in the odds towards a drier-than-average month. However, for southern areas in California and locations around the Bay Area, drought is expected to persist.
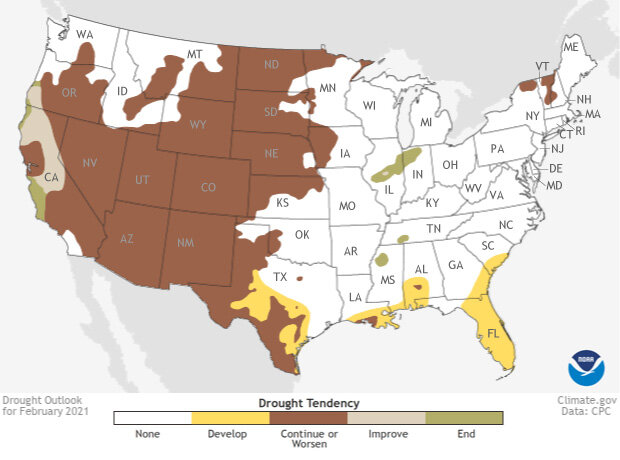
This map shows experts' assessment of how drought conditions are likely to change throughout February 2021. Dark brown areas, such as those covering much of the West, show where drought conditions are likely to persist or worsen, while tan areas show where drought is likely to improve, but not end. Gold shows areas where drought is likely to emerge, while green shows where drought is forecast to end. NOAA Climate.gov Data Snapshots image, based on data from NOAA Climate Prediction Center.
Meanwhile, a monthly temperature and precipitation outlook favoring drier and warmer-than-average conditions across Texas, the Gulf Coast, and Florida has also meant that drought is likely to develop over the region during the next month.
To read the entire discussion of the monthly climate outlooks from the Climate Prediction Center, check out their website. And head back to Climate.gov later this month for a United States and global climate recap of January 2021.