Global climate summary for May 2024
Highlights
- Temperatures were above average over much of the globe, while western North America, southern South America, and western Russia were cooler than average.
- Sea surface temperatures were record warm for the 14th consecutive month.
- Global tropical cyclone activity was above average, with five named storms.
May temperature
The May global surface temperature was 1.18°C (2.12°F) above the 20th-century average of 14.8°C (58.6°F), making it the warmest May on record. This was 0.18°C (0.32°F) above the previous record from May 2020. May 2024 marked the 48th consecutive May (since 1977) with temperatures at least nominally above the 20th-century average. May had a record-high monthly global ocean surface temperature for the 14th consecutive month.
Interactive graph showing global temperature each May from 1850-2024 compared to the 20th-century average. Use your cursor and hover over a specific year or bar to examine individual years more closely. Warmer-than-average years are red; cooler-than-average years are blue. Image by NOAA Climate.gov, based on data from NOAA National Centers for Environmental Information, created with Datawrapper.
The Northern Hemisphere also ranked as the warmest May on record at 1.44°C (2.59°F) above average. The Northern Hemisphere land temperature was also record warm in May (tied with 2020) and the ocean temperature was again record-high by a wide margin (0.25°C/0.45°F warmer than the previous record set in 2020). The Arctic region had its 11th warmest May on record.
May 2024 in the Southern Hemisphere also ranked warmest on record at 0.92°C (1.66°F) above average. The ocean-only temperature for May in the Southern Hemisphere ranked highest on record, while the land-only Southern Hemisphere temperature was 6th warmest on record. Meanwhile, the Antarctic region had its 23rd warmest May, 0.55°C (0.99°F) above average.
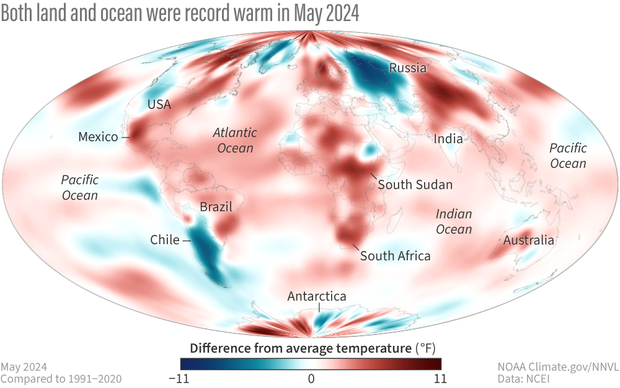
Temperatures in May 2024 compared to the 1991-2020 average. Places that were warmer than average are red; places that were cooler than average are blue. Image by NOAA Climate.gov, based on data from NOAA National Centers for Environmental Information.
Record warm temperatures covered large parts of the African continent, northern China and Mongolia, areas neighboring the North Sea, and many parts of a region stretching from southern Brazil northward through most of Mexico.
Temperatures were warmer to much-warmer-than-average across much of the Arctic, the eastern U.S. and large parts of Canada, western Europe, the eastern half of Russia, southeast Asia, and much of Australia. In northern and central India and Pakistan, where temperatures for the month as a whole were warmer to much-warmer-than-average, a severe and persistent heat wave struck during the last half of the month.
In contrast, cooler-than-average temperatures covered areas that included western parts of Russia and Kazahkstan, much of the western U.S. and Alaska, and large parts of Greenland. May temperatures were also cooler-than-average in Argentina and Chile, where a succession of polar air masses brought the strongest cold wave in more than 70 years to parts of Chile.
Across the global oceans, record warm sea surface temperatures covered much of the tropical Atlantic and large parts of the Indian Ocean and the equatorial western Pacific as well as parts of the southwest Pacific and Southern Ocean. Record warm temperatures also occurred in the North Sea and neighboring seas in the North Atlantic. Positive anomalies also covered large parts of the northern Pacific. Record-warm temperatures covered approximately 16.1% of the world's surface this May, which was the highest percentage for May since the start of records in 1951, and 11.2% higher than the previous May record of 2016.
Near-average to cooler-than-average temperatures covered large parts of the southeast Pacific, the southwest Atlantic, areas of the southwest Indian Ocean, and parts of the Southern Ocean. Only 0.2% of the world's surface had a record-cold May.
May precipitation from land-based stations
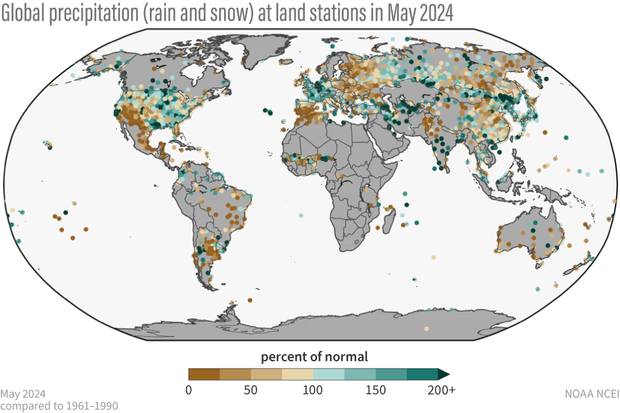
Above-average May precipitation occurred across large parts of western and central Europe, central Asia, far northeastern China, Korea, and Japan. Other wetter-than-average areas included the southern half of India, central Australia, and much of the Seychelles and Mauritius. Precipitation was below average in the southwestern U.S., Mexico, Central America, much of Brazil and Argentina, and much of eastern Europe. Other areas with widespread drier-than-average conditions included much of the United Kingdom, Spain and neighboring parts of Morocco and Algeria, northern India and neighboring Pakistan and Afghanistan, eastern China, southern and western areas of Australia, and many islands of the South Pacific.
Percent of normal precipitation for global land-based stations in May 2024 compared to a base line of 1961 to 1990. Places that received more precipitation than average are colored green; places that received less precipitation than average are colored brown. Gray areas represent missing data. Image by NOAA Climate.gov, based on data from NOAA National Centers for Environmental Information.
For information on 2024's year-to-date temperature ranking, notable climate events, and separate statistics for Earth's land and ocean areas see the full May 2024 monthly report from NOAA NCEI.
Satellite summary of global precipitation patterns
Headlines
- The Niño 3.4 Index [the primary dataset for tracking the El Niño-Southern Oscillation climate pattern] decreased during the month to a near neutral value indicating continued transition from El Niño and this is reflected in observed anomaly patterns [depatures from average].
- Tropical cyclones were active in both the North and South Indian Ocean and helped to produce the observed patterns.
- North America was mainly wet in the east and dry in the west, with Mexico continuing in drought and parts of the southwest U.S. moving toward drier conditions.
- Global precipitation remains high with this May setting the record high for this month of the year.
Difference from average precipitation around the world in May 2024 compared to the 1979-2020 average. Places that received more precipitation than average are colored blue; places that received less precipitation than average are colored brown. Map by NOAA Climate.gov, based on data provided by the Global Precipitation Climatology Project (University of Maryland).
The dominant tropical rain features this May continue on their seasonal northerly progression and with the continued withering of the El Niño-associated SST [sea surface temperature] maximum in the central Pacific along the Equator, the pattern of anomalies (anomaly means “departure from average”) seems to contain some features of the leftover El Niño and maybe some of a more La Niña type. The Niño 3.4 SST index was just about neutral at the end of May and the climate forecasts have a gradual shift to La Niña over the next few months. In general both the tropical Pacific and Atlantic are cooling somewhat, but are still relatively warm compared to average conditions.
In the tropical central Pacific the rainfall anomaly pattern is mixed but dominated by a broad negative area with a narrow, intense positive anomaly on the north side of the ITCZ [Intertropical Convergence Zone, a band of clouds and storms near the equator]. In the far eastern Pacific negative anomalies are consistent with below average SSTs there, a likely start to La Niña conditions moving westward. To the west over the Maritime Continent a positive anomaly holds forth, especially over land, again more like a La Niña pattern.
The regional positive anomaly on the monthly scale over the Maritime Continent was associated with some heavy rainfall events and deadly floods and landslides in Sumatra and later a devastating landslide in Papua New Guinea with ~200 dead (although there was also mention of an earthquake in the mix, too). Farther north the seasonal Meiyu or Baiu front was active showing positive rainfall anomalies in Indochina, through Japan and beyond.
In the eastern Pacific, there was a lack of tropical cyclones, which usually start to appear in May. The Indian Ocean, however, had tropical cyclone activity both north and south of the Equator this month. Early in the month TC Hidaya slid along the coast of Kenya, producing significant rain there, and later in the month TC Laly hovered near the north point of Madagascar. Both storms contributed to the strong positive rainfall anomaly in these regions (mostly over ocean). Over central Africa a rainfall deficit dominates, as is also the case near the southern tip of the continent.
Heavy rains during the month were also noted in southern India, and near the end of the month TC Remal came up the Bay of Bengal and struck Bangladesh and northeastern India with heavy rainfall and flooding. In summary, as seen in the map, there was an early start to the monsoon season in South Asia.
Over Europe, France and Germany had a surplus of rainfall, while the Iberian Peninsula, eastern Europe and Scandinavia had deficits. The rest of Asia north of the Himalayas was near normal, although northern Afghanistan had floods that reportedly left 300 dead.
In North America, Mexico continued their drought (along with a heat wave) with additional rainfall deficits, while the pattern across the U.S. had wet conditions in the eastern half and dry conditions over the southwest as an extension of the Mexican feature. The rain surpluses in the Southeast led to floods in southern Texas, especially Houston. The general east-west pattern extended north into Canada, with fires making an early season comeback in western Canada.
In South America rainfall surpluses were dominant in the north, with dry conditions across much of Brazil, except for the very strong rainfall feature over southernmost Brazil right at the coast, associated with widespread and long-lasting floods there.
On a global basis the mean surface temperature remains high along with mean global precipitation. In fact, the May 2024 estimate of global observed precipitation is the highest May on record (1983-2024) [Reminder: This statistic is for the satellite record compiled by the Global Precipitation Climatology Project.] This may be a last gasp effect of the El Niño (in addition to the long-term global warming). If the coming months transition to La Niña, it may be interesting to use the change to try to separate the long-term (global warming) from the inter-annual (ENSO) effects on global precipitation.


