January 2021 outlook: wetter and warmer than average for much of the United States
Happy new year! We all know keeping New Year’s resolutions is often a fruitless endeavor, but here’s hoping that Mother Nature will make—and keep—a resolution for a less bonkers climate year in 2021. To kick start 2021 in the United States, the January outlook from NOAA’s Climate Prediction Center favors wetter- and warmer-than-average conditions for much of the country, which is particularly good news across drought- and wildfire-stricken parts of northern California.
Here’s your first reminder of the new year from Climate.gov: the climate outlook maps are not a forecast for the absolute temperature or precipitation amounts in January. Instead, they are the probability (percent chance) that January temperatures or precipitation will be in the upper, middle, or lower third of the climatological record (1981-2010) for January (more on how that will change shortly further in this post). We refer to these categories as “well above” and “well below” average. The colors (red or blue for temperatures, brown or teal for precipitation) indicate which outcome is the most likely. Darker colors reflect higher chances of a given outcome; not more extreme conditions. Head to the end of this post for more on the math behind the outlooks.
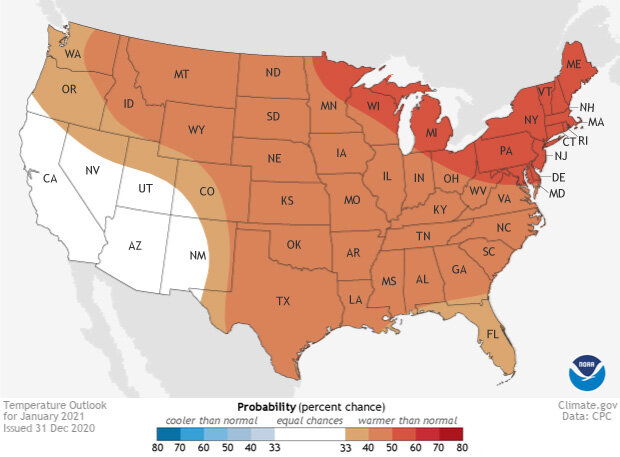
Places in the Lower 48 states where the forecast odds for January 2021 favor a much colder than usual January (blue colors) or much warmer than usual January (red), or where the probability of a cold January, a warm January, or a near-normal January are all equal (white). The darker the color, the stronger the chance of that outcome (not the bigger the departure from average). NOAA Climate.gov map, based on forecast data from NOAA CPC.
Stop me if you’ve heard this before. Monthly temperatures likely to be warmer than average across much of the United States
Like many prior monthly outlooks, the January 2021 outlook has much of the country favored to observe a warmer-than-average start to the new year. However, the odds are only moderately tilted towards a warmer-than-average outcome. The best chance to seeing monthly temperatures well above average falls across the Great Lakes, Mid-Atlantic and New England, with a smaller tilt in the odds towards warmth across the South, Great Plains, northern Rockies and the Pacific Northwest.
The only exception to the favored warmth is over the Southwest, California and Alaska (see AK maps here), where there is an equal chance of above-, below- or near-average temperatures for January.
One reason for the not-as-high chances for warmth this month is due to some confounding atmospheric factors that make things a little bit more uncertain than normal. These involve potential influences from the Madden-Julian Oscillation, as well as a weakening polar vortex. If each event ends up occurring and impacting the United States, they could have a strong influence on the monthly temperature patterns. However, at this point, it is too difficult to say with any confidence whether that will happen. Hence, the forecast leans on atmospheric models that suggest warmth is favored, but with lower probabilities due to the potential for some atmospheric craziness to start the year.
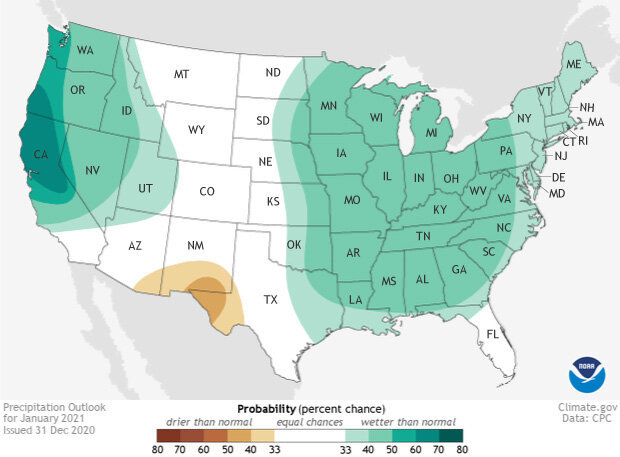
Places in the Lower 48 states where the forecast odds for January 2021 favor a much wetter than usual January (green colors) or much drier than usual January (brown), or where the probability of a wet January, a dry January, or a near-normal January are all equal (white). The darker the color, the stronger the chance of that outcome (not the bigger the departure from average). NOAA Climate.gov map, based on forecast data from NOAA CPC.
Wetter-than-average conditions likely for much of the country. Even California. Yes, you heard that right.
For the past year, the discussion of the monthly outlook for precipitation has revolved around a drier-than-average forecast for locations already suffering under drought conditions. But January 2021’s precipitation outlook flips the script. Instead, much of the country is favored to observe a wetter-than-average January, including the central and eastern United States as well as the Pacific Northwest, central/northern California, and the northern Southwest.
The highest chance for above-average precipitation (60-70%) is in northern California and southern Oregon. This is mainly due to a predicted wet start of the month across the West Coast. This is a great forecast for areas in northern California that suffered through horrible wildfires and drought in 2020, and that have also observed a very sluggish start to the rainy season, which began in October.
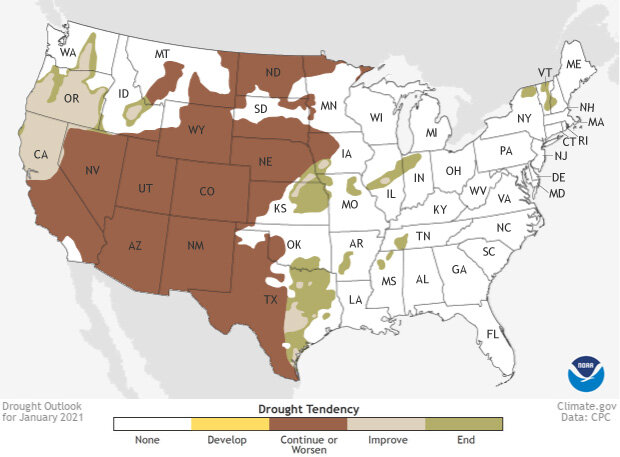
This map shows experts' assessment of how drought conditions are likely to change throughout January 2021. Dark brown areas, such as those covering much of the West, show where drought conditions are likely to persist or worsen, while tan areas show where drought is likely to improve, but not end. Gold shows areas where drought is likely to emerge, while green shows where drought is forecast to end. NOAA Climate.gov Data Snapshots image, based on data from NOAA Climate Prediction Center.
Western wetness could help improve drought conditions
All of that wetness favored for northern California and Oregon during January is likely to have the beneficial impact of improving drought conditions that are currently either severe or extreme. However, for much of the rest of the western United States, including the huge area in the Southwest (almost 10% of the country) currently in exceptional drought, little drought relief is likely in January.
Meanwhile, over the eastern United States, the wetter-than-average forecast for January is likely to help remove the last remaining bits of drought across New England and the Great Lakes.
Overall, 2021 started the year with nearly half the country experiencing some form of drought. And according to the latest drought outlook, by this time in February that number should be smaller.
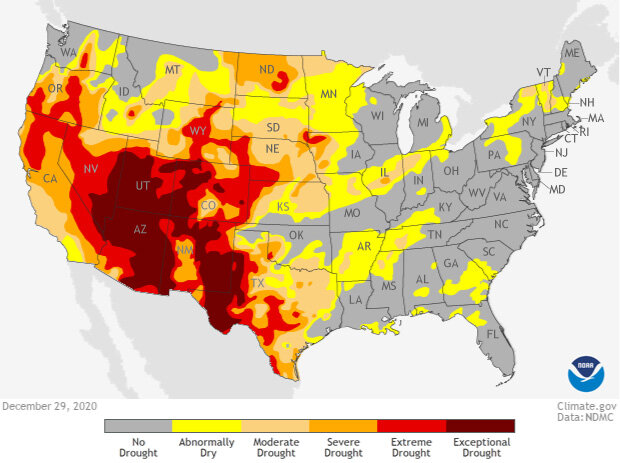
Drought conditions as of December 29, 2020, across the contiguous United States. severe (orange) and extreme (red) drought conditions were widespread across the West. NOAA Climate.gov image from the Data Snapshots collection, based on data from the U.S. Drought Monitor project.
It’s a new year and a new decade. When are you changing the climatological period?
In the beginning of this post, I mentioned that we use a climatological period of record of 1981-2010. These thirty-year periods are updated every 10 years, which means that as of 2021, we will be updating to 1991-2020. But these changes don’t happen immediately! So for the time being, these outlooks will continue to use the 1981-2010 period for “average” purposes. But at some point in the next year, this will shift to 1991-2020. Don’t worry about trying to figure out when that change occurs! We’ll be sure to let you know when it happens.
To read the entire discussion of the monthly climate outlooks from the Climate Prediction Center, check out their website. And head back to Climate.gov later this month for a United States and global climate recap of December 2020.