Short-term Cooling on a Warming Planet
"There IS a problem with global warming," one headline recently quipped, "it stopped in 1998." Making the same argument about declining temperatures since 1998, another headline proclaimed, "Alarmists still heated even as world cools."
These articles suggest that climate scientists have misled the public. While climatologists warn that greenhouse gas emissions from burning fossil fuels are warming our planet, some people argue that Earth is actually cooling: they point to declining temperatures since 1998 as "proof" that global warming has stopped.
But this argument about global cooling begs an important question: Why measure temperatures since 1998? Why not 1997 or 1999?
Global temperature anomalies from 1992 through 2008 as estimated by the Hadley Centre. Temperatures are shown as the difference from the 1961-1990 average. The colored lines drawn on the graph illustrate how temperatures for 1997, 1998, and 1999 compare to 2008.
The answer might lie in the fact that 1998 was arguably the warmest year on record. "The reason we had such a warm 1998 is that we had a very, very strong El Niño, probably one of the strongest El Niños of the twentieth century," explains David Easterling, Chief of the Scientific Services Division at NOAA's National Climatic Data Center. "If you have a very strong El Niño-an extensive swath of the ocean's surface with much-warmer-than-average temperatures-that tends to warm the globally averaged air surface temperature."

David Easterling of NOAA’s National Climatic Data Center.
If global temperatures from subsequent years are compared to those of 1998, warming since that time is certainly difficult to detect. Easterling himself pointed out in a 2009 paper that a linear trend line from 1998 to 2008 shows no statistically significant trend up or down. While a straight line drawn from 1998 to 2008 does indicate that 2008 was cooler, a line from 1999 to 2008 shows that the planet warmed, and a line from 1997 to 2008 is almost flat. But Easterling doesn't advocate starting the measurements from either of those years. Instead, he suggests looking at the bigger picture.
"The bottom line is that current temperatures are way above the long-term average," Easterling says. The United Kingdom's Met Office and the World Meteorological Organization concur; in December 2009, the organizations described the first decade of the twenty-first century as by far the warmest on record.
Average global temperature anomalies by decade, estimated by the Hadley Centre, shown as the difference from the 1961 – 1990 average. Vertical lines indicate the upper and lower 95% uncertainty ranges for each decade.
The cooling argument is challenged even further in that not every estimate pegs 1998 as the warmest year. One group of climate researchers instead finds 2005 to be the warmest year. The difference doesn't result from error or whim, but from the inherent difficulty in measuring global temperatures.
The Challenge of Measuring the Past
Michael Schlesinger, of the University of Illinois at Urbana-Champaign.
Michael Schlesinger is a professor in the Department of Atmospheric Sciences at the University of Illinois at Urbana-Champaign, and he has devoted almost four decades to studying global climate. He has worked extensively with global temperature records, and he recognizes their limitations. "The observations of temperature over Earth were not made for the purpose of climate, they were made for the purpose of weather," he says. People naturally built weather stations where weather conditions would affect human activity, which excluded sparsely populated or rarely traveled areas. The addition of new weather stations over the years has enhanced recent temperature records, but not historical records. Meanwhile, some older weather stations have been moved, for instance, from city centers to airports. More importantly, the weather stations have focused on land even though oceans cover 70 percent of our planet.
"Earth is unique in our solar system in that it has an ocean," Schlesinger explains. "The atmosphere stirs the ocean by wind, and as warm surface waters mix with cooler waters below, they take heat away from the surface. This reduces the amount of surface warming that would occur if Earth were all land." This complicates the task of calculating a representative average temperature for the entire globe, and different research groups choose different methods to account for the complexities.
"If you had the ability to uniformly distribute thermometers over the planet, and gather measurements from this regular grid, then I think everybody would analyze the data in the same way," Schlesinger says. On our real world, however, climatologists must work with "a hodgepodge of measurements over the continents." Not surprisingly, climatologists have developed more than one approach to understanding historical temperature records based on weather station measurements.
Global temperature anomalies estimated by NASA’s Goddard Institute for Space Studies (GISTEMP) and the UK Met Office and the University of East Anglia’s Climatic Research Unit (HadCRUT3). The consistently higher temperature indicated by GISTEMP is the result of the two groups measuring anomalies from different base periods: GISTEMP values show how much the world has warmed compared to the average from 1951 – 1980 while HadCRUT3 values show the change from the 1961 – 1990 average. Differences in how each group calculates global temperature result in differences in each year’s ranking. HadCRUT3 lists 1998 as the warmest year, followed by 2005 and 2003. GISTEMP shows 2005 as the warmest year, followed by 2007 and 1998.
Two of the world's foremost global temperature data sets are from the Hadley Centre in the United Kingdom, and the NASA Goddard Institute for Space Sciences (GISS) in the United States. Both groups use a combination of land-surface air temperature and sea-surface temperature records, incorporated from satellite observations and historical records, to calculate values for global temperature. Though the groups use different equations in processing the data, they do so consistently so their successive values indicate how global temperature has changed over time.
One area that has experienced some of the most dramatic warming in recent years-but lacks permanent weather stations-is the Arctic, and the Hadley Centre and GISS handle the lack of observations in the region differently. The Hadley Centre offers a data set that works only with existing temperature measurements, essentially excluding the Arctic from its global temperature calculations. GISS offers a data set that accounts for Arctic temperatures by interpolating from the surrounding region. Like the Arctic, the high-latitude region around it has seen greater rates of warming than the global average over the last decade, including substantial warming in 2005. As a result, the Hadley data set identifies 1998 as the warmest year on record whereas the GISS data set identifies 2005 as the warmest year on record.
"It's a question of whether you interpolate or not, and different people handle it differently," observes Easterling. "There's no exactly right or wrong way." And his overriding conclusion remains: Recent years rank among the warmest on record.
Deciphering Natural Variability
"There are two components influencing temperatures over time," Easterling says. "You have a trend due to increasing greenhouse gases and you have natural variability superimposed on that trend."
Beyond our control, natural variability includes large-scale oceanic changes affecting regional and global temperatures. Cooling between 2006 and 2008, for instance, has likely been driven by La Niña. Opposite of El Niño conditions, the area of cooler-than-average sea surface temperatures that defines La Niña conditions can push global temperatures downward, if the phenomenon is strong enough.
Schlesinger, who has served as a co-author for the Intergovernmental Panel on Climate Change, knows quite a bit about natural variability. In 1994, he described the Atlantic Multi-decadal Oscillation, an alternating pattern of heat-distributing ocean circulation that brings warmed waters from the tropics to high latitudes. "On average, ocean circulation transports a petawatt of heat," Schlesinger explains. "A petawatt is the numeral 1 with 15 zeros after it, or a million billion watts of heat energy. If you could just acquire one percent of that heat, you could satisfy all your energy needs for planet Earth." One cycle of the oscillation takes about 65 to 70 years. Over that time, the amount of heat moved northward along the western side of the North Atlantic Ocean waxes and wanes, increasing and decreasing temperatures in the North Atlantic Ocean and the surrounding continental margins.
Although not directly dictated by this decades-long phenomenon, global temperatures are influenced by the oscillation, just as average temperatures can be driven up or down by El Niño and La Niña events. The transport of such a massive quantity of heat helps explain some counterintuitive temperature trends during the twentieth century. Despite the increase in greenhouse gas concentrations that began in the mid-1800s, between 1850 and 1900, global temperatures showed little significant change. Between 1900 and 1940, temperatures rose. After 1940, temperatures declined for 35 years. The lack of a direct correlation between greenhouse gas concentration and global temperature over this time span "was confounding understanding of the observed temperature record," Schlesinger recalls, "and it was allowing people to make the argument, 'If there was this early twentieth-century warming when humanity was putting relatively fewer greenhouse gases into the atmosphere, why wasn't there a larger temperature increase later when humanity was putting vastly more greenhouse gases into the atmosphere?' By discovering this oscillation, we were able to refute this argument."

Global Average Temperature compared with the Atlantic Multi-decadal Oscillation (AMO) Index. The AMO Index is the average sea-surface temperature over the North Atlantic Ocean. The roughly parallel curves of the two parameters show that they are related: the increase in global temperature over time, coincident with the increase in greenhouse gases observed since the Industrial Revolution, is alternately obscured and enhanced by the AMO.
Like Schlesinger, Easterling is also familiar with natural variability, and his knowledge of such variability caused him to question the cooling-since-1998 argument. Working with his co-author Michael Wehner, Easterling examined both observed temperatures and model simulations. Confident that the "cooling" was a short-term trend, Easterling wanted to see if he could find periods of no trend or with slight cooling over other time spans. He could.
For observed temperatures, Easterling relied on a data set generated by NOAA's National Climatic Data Center, incorporating globally averaged surface air temperatures from 1901 to 2008. In that data set, he found two periods-1977 to 1985 and 1981 to 1989-that showed slight cooling, similar to what appears in the Hadley Centre's data set from 1998 to 2008.
Global temperature anomalies calculated by NOAA for 1975 through 2008. Despite the long-term warming trend evident in the graph at the bottom, global temperature decreased slightly from 1977 to 1985 and from 1981 through 1989, as shown by blue arrows in the insets. Graph modified from Easterling, 2009.
Easterling used a database of predicted temperatures, validated by its ability to retroactively "predict" temperatures for years past. He assumed a "business-as-usual" scenario in terms of greenhouse gas emissions, with little future reduction. When projecting temperatures for the twenty-first century, he found two more periods-2001 to 2010 and 2016 to 2031-that showed no trend, again similar to 1998 to 2008. Every one of these no-trend periods occurred against a backdrop of rising temperatures.
"The supposed cooling is really a non-issue," Easterling explains. "It's just natural variability."
What the Future May Hold
Easterling's finding that natural variability can cause short-term cooling, or no-trend periods within longer-term warming, correlates with other predictions about future temperatures.
In May 2008, a group of climate modelers in Germany published projections that incorporated current understanding of natural cycles to make a climate forecast for the next decade. The group forecast that global surface temperatures might not increase much over the next decade, as cooling driven by natural variability offsets human-caused warming. After a decade or so of stability, however, the model indicates that temperatures would begin to rise. In contrast, the UK Met Office predicted warming beginning in a few years from 2009. Both groups, however, agreed that after a short period of negative or no trend in the early 2000s, global temperatures would begin to rise, perhaps quickly.
In other words, the no-trend period in the Hadley Centre's data set not only doesn't surprise these climatologists, it's consistent with what they have predicted. "You're going to see these episodes where you don't get warming in the surface air temperature and then it starts back warming very strongly," Easterling says.
"If it kept cool for the next 25 years, I'd think maybe I was wrong," Easterling continues, "but you can see periods as long as 16 years in our model run where temperatures stay the same without changing the long-term trend."
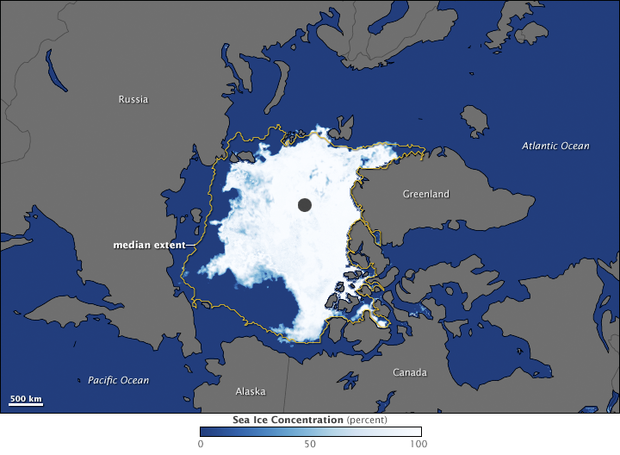
Each year, the area covered by Arctic sea ice melts to its smallest extent by the end of summer in September. This map shows the median extent of sea ice during September from 1979-2000 (in yellow), and the minimum extent observed in 2009. Image courtesy of NASA Earth Observatory and National Snow and Ice Data Center.
Besides global temperatures, other lines of evidence point strongly to a warming planet. Since 1998, the extent of Arctic sea ice reached new record lows in 2002, 2005, and 2007. Arctic sea ice retreated so dramatically in 2007 that it broke all previous records a month before the end of melt season. And dramatic changes haven't been unique to the Arctic. In 2002, some 3,250 square kilometers of the Larsen B Ice Shelf on the Antarctic Peninsula shattered over a period of just five weeks. In the wake of the ice shelf disintegration, glaciers feeding the shelf accelerated on their route into the Weddell Sea. "The reason people believe strongly that Earth has warmed is not just the temperature record, but all these other things," Easterling explains.
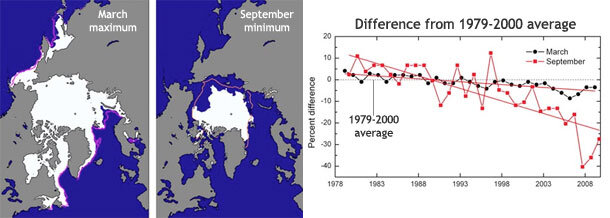
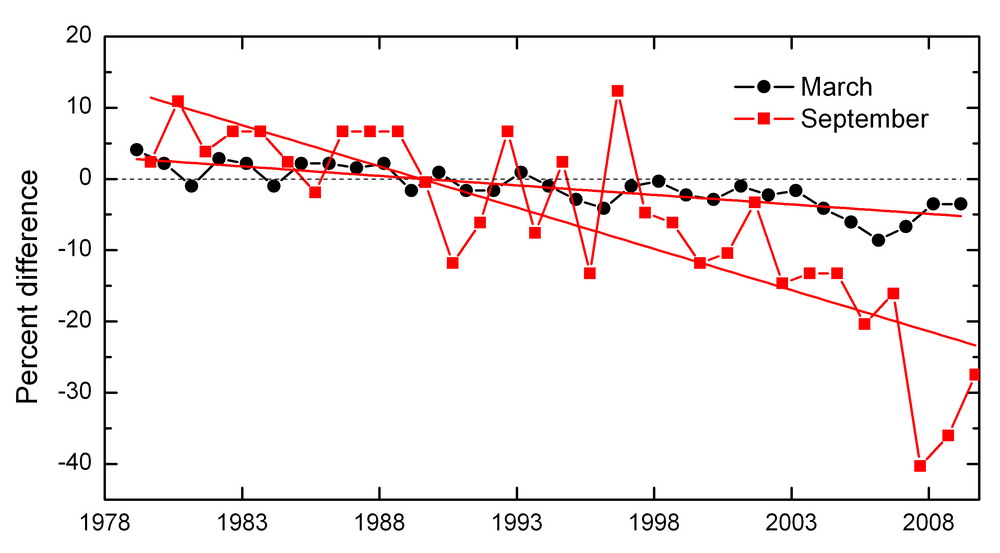
Maximum Arctic sea ice extent for 2009 occurred in March, and minimum Arctic sea ice extent occurred in September 2009. In each image, the magenta line indicates the median extent of ice cover for that month for the period 1979–2000. Both minimum and maximum sea ice extents have decreased over the period of satellite observation. This graph shows the trends in minimum extent (red) and maximum extent (black) from 1979–2009 as the percentage difference in ice extent compared to the mean from 1979-2000. Maps courtesy of National Snow and Ice Data Center. Graph courtesy of Arctic Report Card. large versions: maps | graph
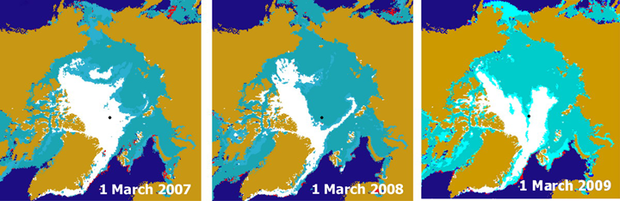
The colors on these maps show Arctic sea ice distribution in March 2007, 2008, and 2009. Multiyear ice is shown as white, mixed ice is aqua, first-year ice is teal, and ice with melting on the surface is red. Dark blue represents open water and gold is land. These images were prepared using a combination of satellite observations and drifting ice buoys. Courtesy of Son Nghiem and Arctic Report Card.
"When you're in a court of law, you have to swear to tell the truth, the whole truth, and nothing but the truth. The people who have been focusing on the cooling have not been telling the whole truth," Schlesinger remarks. "Natural variability may mask the effects of greenhouse gas emissions in the short term, but once an oscillation changes back to a mode that increases global temperatures, it will reinforce the effects of burning fossil fuels, and we could face a double whammy. So the worst mistake we could make is to confuse short-term cooling for a reversal of global warming."
References:
Andronova, N.G., Schlesinger, M.E., (2000). Causes of global temperature changes during the 19th and 20th centuries. Geophysical Research Letters. 27(14), 2137-2140.
Black, R. (2009, December 2). Climate science, from Bali to Copenhagen. BBC. Accessed December 10, 2009.
Black, R. (2009, December 8). This decade "warmest on record." BBC. Accessed December 10, 2009.
Borenstein, S. (2009, October 27). Global cooling claim not supported. Associated Press. Accessed December 10, 2009.
Carter, B. (2006, April 9). There IS a problem with global warming . . . it stopped in 1998. Telegraph.co.uk. Accessed December 10, 2009.
Earth System Research Laboratory, Physical Sciences Division. Time Series: AMO (Atlantic Multi-decadal Oscillation) Index. Accessed December 20, 2009.
Easterling, D.R., Wehner, M.F. (2009). Is the climate warming or cooling? Geophysical Research Letters. 36, L08706, doi:10.1029/2009GL037810.
GISS (Goddard Institute for Space Studies) Surface Temperature Analysis (GISTEMP). Accessed December 10, 2009.
Investor's Business Daily. Article reproduced at RealClearMarkets (November 8, 2008). Accessed December 10, 2009.
Keenlyside, N.S., Latif, M., Jungclaus, J., Kornblueh, L., Roeckner E. (2008). Advancing decadal-scale climate prediction in the North Atlantic sector. Nature. 453, 84-88, doi:10.1038/nature06921.
Met Office Hadley Centre Observations Datasets. HadCRUT3 dataset. Accessed December 10, 2009.
National Climatic Data Center, Global Surface Temperature Anomalies. Accessed December 22, 2009.
National Snow and Ice Data Center. State of the Cryosphere. Accessed December 10, 2009.
NOAA Response to Congressional Questions Regarding Climate Change, The Honorable Joe Barton and the Honorable Fred Upton. Updated November 2009. Accessed December 10, 2009.
RealClimate. (2009, October 6). A warming pause? Accessed December 10, 2009.
Schlesinger, M.E., Ramankutty, N. (1994). An oscillation in the global climate system of period 65-70 years. Nature. 367, 723-726.