As storms and sea level rise reshape beaches, volunteers keep track of changing coasts
This story is condensed from a longer, interactive feature published by New Hampshire Sea Grant on April 27, 2020.
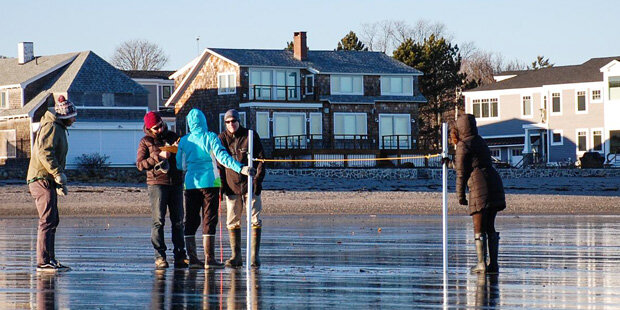
It was sunny in Hampton, New Hampshire, in mid-February, which meant the beach was packed with dog walkers enjoying the weather, despite temperatures struggling to crest forty degrees. Just before noon, a group began to gather at the edge of the sand below the sea wall, unsheathing long red and white striped poles paired together with a yellow rope and eyeing the beach with proud, inquisitive eyes.
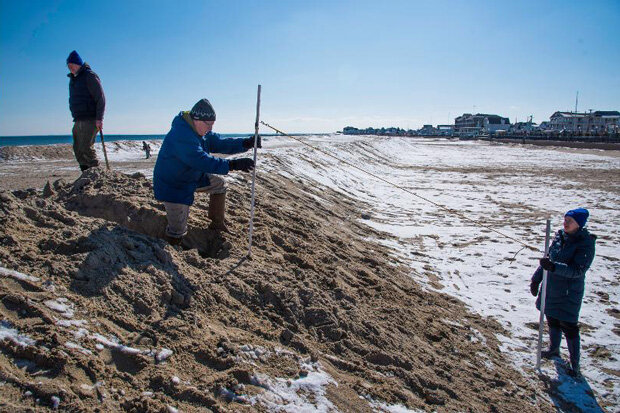
On a sunny winter day, three volunteers hacked a slot through a berm on New Hampshire's Hampton Beach in order to sight along a short rope that they use to measure the beach's width and slope each month. Photo courtesy New Hampshire Sea Grant.
Mike and Terry Stockdale, Sherri Townsend, and Marc Tosiano are part of the Coastal Research Volunteer program, and this stretch of sand is their territory—Hampton Beach South, or HB02 on their datasheet. The team had convened to measure their beach’s profile—the shape and slope of the sand as it arcs down from the boardwalk to meet the shore. Taking measurements monthly, the volunteers help track the rise and fall of the sands under the knife of storms and slow hoarding of calmer seas.
Sea Grant: Coast to Coast Collaboration
The Hampton Beach profilers and their fellow Coastal Research Volunteers are a community group facilitated by New Hampshire Sea Grant. The National Sea Grant College Program (Sea Grant) is a NOAA-funded network of 34 programs in each of the U.S. coastal and Great Lakes states. Sea Grant supports research, education, and outreach to help balance the conservation of coastal and marine resources with a sustainable economy and environment.
In addition to New Hampshire, Sea Grant also engages community volunteers in monitoring beaches in California and Maine. All rely on dedicated “citizen scientists” to collect critical data on the erosion and health of their state's sandy beaches. Beach profiling volunteers measure changes in beach slope with a pair of two-meter poles, a short connecting rope, and the horizon line.
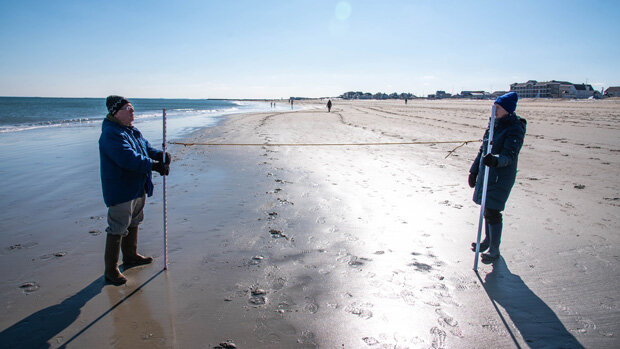
On a sunny winter day, two volunteers measure the slope of Hampton Beach at the water's edge. Photo by New Hampshire Sea Grant.
With a volunteer holding each pole, the landward volunteer aligns the top of the seaward pole with the horizon by crouching or moving their head up or down, using their pole to measure the elevation change from one pole to the other based on the horizon. They leapfrog down the shore to measure the change in height as the beach rolls into the surf.
Easy to learn and inexpensive to set up, Sea Grant’s beach profiling programs have compiled vital data from both the Atlantic and Pacific coasts—informing beach management decisions and tracking the impacts of erosion, sea-level rise, and climate change on our sandy shores.
Frigid shores and winter storms
The Southern Maine Volunteer Beach Profile Monitoring Program, managed by Maine Sea Grant, traces its roots to the Blizzard of 1978, a historic storm that changed the way Maine thought about its beaches. Though known for its rocky coastlines, Maine's southern sandy beaches are critical for the towns that surround them—attracting tourists who support the local economy. For these beach communities, the blizzard meant huge changes in the shape and structure of their beaches. The overnight transformation was a wakeup call, sparking new policies that heavily restricted construction and development in dune systems.
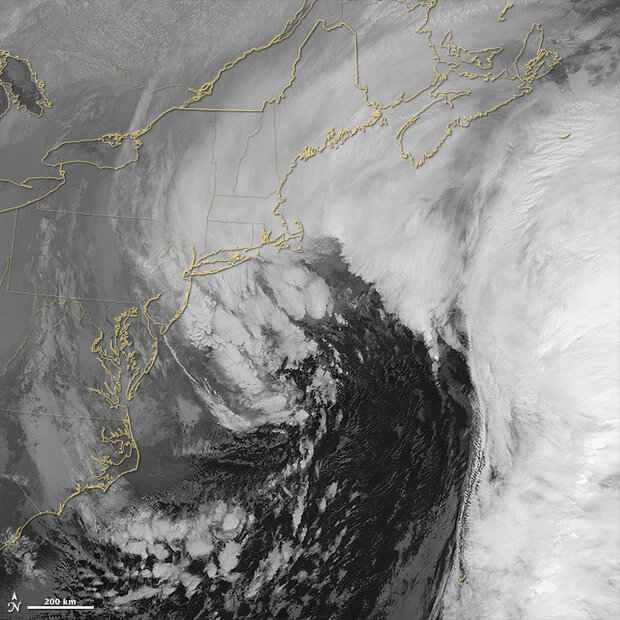
Winter storms called nor'easters can pummel New England states with hurricane-like winds and storm surges. Such storms have a long history of reshaping the region's sandy beaches overnight. This January 27, 2015, satellite image captured a powerful nor'easter as it battered the coast from Maine to New Jersey. NASA image courtesy the Earth Observatory.
In 1999, geologists from the University of Maine and Maine Geological Survey saw beach profile monitoring as a way to "bring coastal property owners, scientists, and regulators together to work toward a common understanding about the status of Maine’s sandy beaches, because there was lots of conflict among those three different stakeholder groups," said Maine Sea Grant’s Kristen Grant, program manager for the beach profile volunteers.
Almost four hundred volunteers have been directly involved with Maine’s beach profiling program since 1999. Coastal towns contribute funds for each beach that volunteers monitor. In return, the towns receive a set of volunteer eyes tracking changes on their beaches as sea levels rise, storms intensify, and more tourists flock to the coast.
Betsy Smith has volunteered to profile Gooch’s Beach in Kennebunk, Maine for five years and sees the beach differently now, having watched it closely through her measurements. Beaches drive a large part of the local economy in Smith's community of Kennebunk.
“We get about a 50% population surge in the summer, and those people show up, they don't really have that connection that sees the beach in all weather, up and down and winter and summer,” said Smith. “I think they're blissfully ignorant of changes that are underway.”
From York to Portland, Maine communities use beach profiling data for dune restoration, beach nourishment, endangered species management, and designs for shoreline armoring. The data volunteers have provided can guide decision-makers into avoiding common issues, like sea walls, that can often cause more erosion than they prevent.
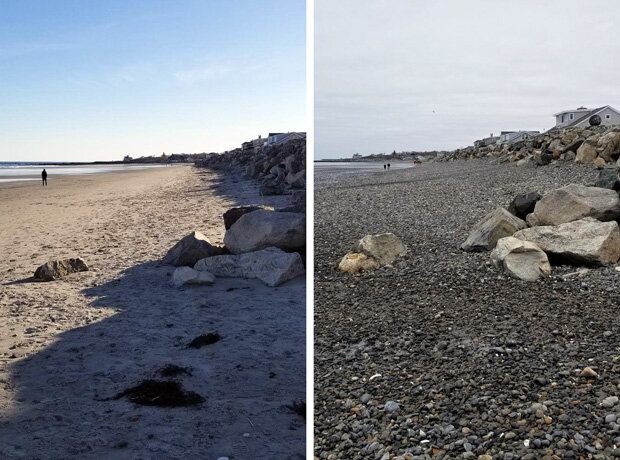
A photo of Maine's Drake Island Beach on March 4, 2018, just after a nor'easter. The storm stripped all the sand off a portion of the beach below a sea wall. Photo by Flickr user Bud, used under a CC license.
The volunteers’ observations feed back to their communities in other important ways. John Cannon, a Senior Meteorologist at the National Weather Service Forecast Office in Gray, Maine, is one of the forecasters whose job it is to predict the impacts of Nor'easters. When he read about Maine Sea Grant’s beach profiling efforts in a local newspaper, Cannon says, “a light bulb went off in my head. We [the National Weather Service] have been forecasting beach erosion in our statements and warnings for decades but have never verified our warnings with actual data.”
He got in contact with Kristen Grant, who helped Cannon put together a storm team of volunteers who could head out and take measurements just before and after a significant storm. “That way we know the geological changes of the beach and dune profiles from that particular weather and wave event. This data provides valuable information to our forecast staff to calibrate our models for future erosion events,” Cannon wrote about the volunteers in an email.
Following the severe nor'easter that TV meteorologists referred to as Winter Storm Riley, Hampton Beach was steeply eroded in early March 2018. Measured again on June 15th, the beach had replenished a significant amount of sand. Image by Tim Briggs, based on Coastal Research Volunteers with New Hampshire Sea Grant.
Researchers can’t always be watching the beach, but the volunteers serve as watchful and ready responders. In early 2018, three strong Nor’easters hit New England within weeks. The storms combined strong winds, measuring close to 100 miles per hour in Massachusetts, with record-high tides, feet of snow, and extreme storm surge. In both Maine and New Hampshire, volunteers were called into action.
“That was a particularly devastating set of storms,” said Larry Ward, a research associate professor at the University of New Hampshire’s Center for Coastal Ocean Mapping. “The closeness of the occurrence of the storms didn't allow the beach to recover in between.”
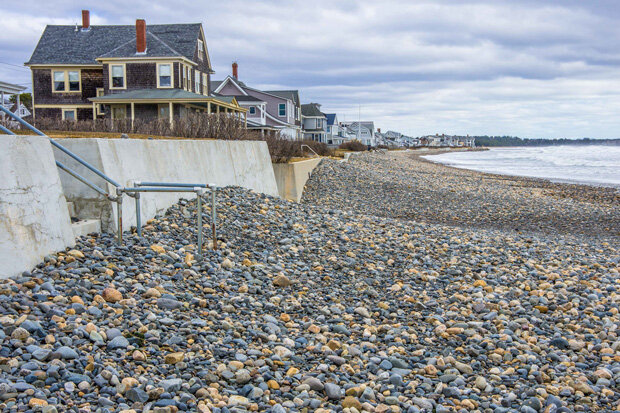
Jenness Beach, in Rye, New Hampshire, before (left) and after (right) a nor'easter on March 2, 2018, that stripped the beach of much of its sand, leaving cobble and rocks. Such events require continual restoration, and sea level rise and changes to storm frequency or intensity due to climate change will heighten the challenge. Photo by New Hampshire Sea Grant.
The data on beach erosion collected by volunteers in New Hampshire were used widely by state legislators, coastal resources managers, and municipal and state beach managers “to understand the impacts of the storms on the natural infrastructure (beaches and dunes), how those impacts related to the damage observed to the abutting built infrastructure (roads and sea walls), and the recovery of these systems over time along the coast,” according to Alyson Eberhardt of New Hampshire Sea Grant.
California beaches in peril
Monique Myers, Extension Specialist at California Sea Grant and one of the lead scientists for California’s Community Alliance for Surveying the Topography of Sandy Beaches (CoAST SB), looks at her beaches and sees a tipping point approaching. “Unfortunately, we're looking at losing two-thirds of them in California, by 2100,” Myers warns.
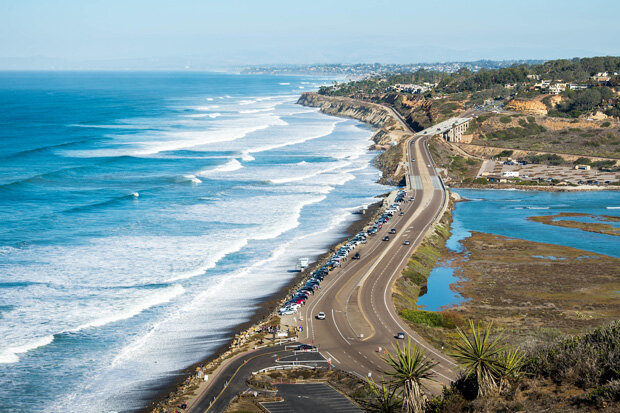
Looking north from Torrey Pines State Reserve. The sandy beach along Torrey Pines Road was underwater on December 13, 2015, during higher-than-average water levels associated with that winter's strong El Niño—a preview of what's in store for the state as sea level continues to rise. Photo by Flickr user AMalecki, used under a CC license.
California communities have already seen beaches retreat due to erosion and sea-level rise, and for residents, that threat can be intimidating. “With these sorts of global challenges, it's easy to feel helpless,” said Kevin Parent, a Santa Barbara resident for almost 25 years. When Parent heard about CoAST SB, California Sea Grant’s beach profiling effort, he and his family jumped at the opportunity.
CoAST SB was modeled after Maine Sea Grant’s beach profiling program; Myers and her colleagues hoped to improve their knowledge about California’s sandy beaches and provide data for USGS shoreline modeling – which local governments use for climate adaptation planning – and enable a grassroots climate change team.
“I was interested in giving people a way to address climate change because…there's evidence that if you've experienced some kind of disaster event, you actually feel more empowered to address it,” Myers said.
The Parent family was witness to such an event in January 2018. “Our beach was completely transformed,” Parent said, remembering his first beach profile after a debris flow demolished neighborhoods in Montecito, California, just a few miles from his family’s home. The debris flow was born from a confluence of extreme climate events: the Thomas Fire, drought, and historic rainfall.
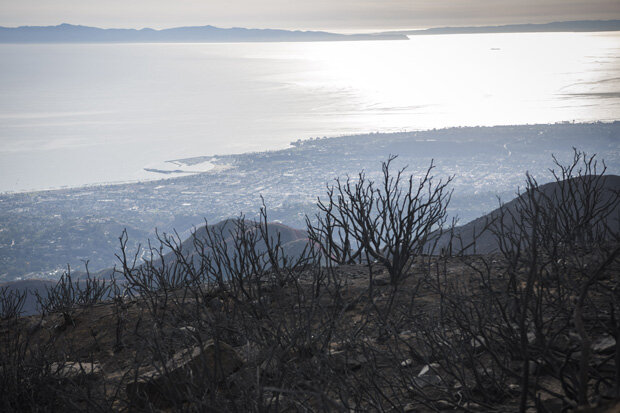
The skeletons of burned shrubs stand along a ridge in the Los Padres National Forest, overlooking the city of Santa Barbara, on December 23, 2017. A few weeks later, heavy rain falling on the burned hillsides triggered deadly, destructive debris flows that washed into the Santa Barbara Channel. Photo by Stuart Palley for the U.S. Forest Service. Used under a CC license.
Driven by unusually strong Santa Ana winds and persistent drought, the Thomas fire was (at the time) the largest wildfire in California’s history. While November usually marks the start of the rainy season in California, skies stayed dry until January 8, 2018. With vegetation burned away, the surrounding hills were primed for a mudslide.
In the early morning hours of January 9, 2018, it poured. In one area, over half an inch of rain fell in just thirty minutes onto the burn scar of the Thomas Fire. Mud, boulders, trees, and other debris tore through Montecito, causing over two hundred million dollars in property damage and taking the lives of twenty-three people.
The debris flow closed roads for weeks and limited travel. About a month after the debris flow event, the Parent family was able to make it out to Summerland Beach, one of their profile sites. They encountered a completely changed landscape and found themselves carefully climbing over debris to take their measurements.
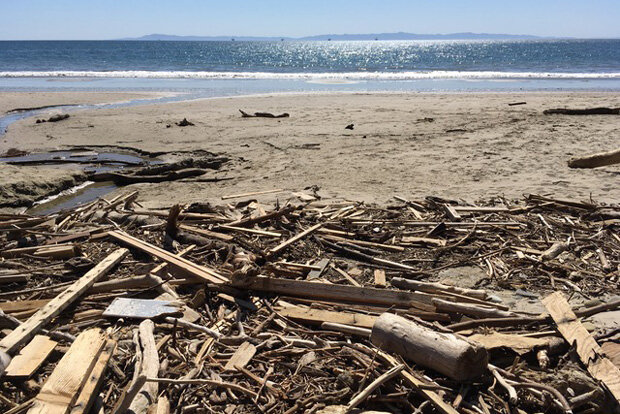
Summerland Beach in February 2018 during the Parent family's beach profile after the Thomas Fire and Montecito debris flow. Photo courtesy California Sea Grant.
Summerland Beach is just east of where the Montecito debris flow had met the ocean. Currents and waves pushed buildings-turned-driftwood and other shattered remnants of the neighborhood onto Summerland Beach. Compared to the average February profile, the beach that day was much taller.
“Usually, in those months, the winter months, you see [profile] graphs that are more representative of erosive trends during that season, steepening the narrowing of the beach,” explained Aaron Howard, CoAST SB program manager at California Sea Grant. “But in this instance, down-current from the mudslide a few miles, we saw more of a sediment deposition event – an accretion of sediment and sand rather than erosion.”
Starting far from the water's edge (left side of graph), volunteers measure the elevation of the beach every 5 meters as it drops to the surf line (right). At Summerland Beach, a typical winter profile would look like October or November 2017: a relatively smooth drop over 45 meters. In February 2018, not only was the beach longer, but there were two humps of deposited sand and debris—unusual for winter. Graph by Tim Briggs, based on CoAST SB data.
The experience cemented the value of a program like CoAST SB for Kevin Parent. "That's what's great about this program, right? It's that we were there, we were measuring it. We wouldn't have gone to the beach that day,” Parent said. “Why would you, except for the fact that it was, you know, social responsibility to do so. And so we did.”
Data making a difference
Because citizen science projects ask volunteers to donate their time to gather data, it’s vital that the data collected are put to work and that volunteers see their efforts contribute to real scientific results. Beyond its value before and after Nor’easters, New Hampshire’s data are used to inform decisions for beach nourishment in coordination with Hampton Harbor’s dredging operation.
Volunteers with New Hampshire Sea Grant recording data at Jenness Beach.
The data from California’s volunteers have been integrated into planning and analysis tools like USGS’s Coastal Storm Modeling System (CoSMoS), Our Coast Our Future, and the Beach Erosion Authority for Clean Oceans and Nourishment (BEACON). Local and regional planning efforts in California have already incorporated these tools into their arsenals.
Thanks to the Maine storm team's contributions, new models from the National Weather Service can forecast beach erosion from a given storm at specific beaches. "These new models require calibrating, and the volunteer network of profilers provide that needed information," wrote John Cannon in an email.
In some cases, the changes seen by volunteers are real indications of our coasts' futures. During an El Niño in 2015 and 2016, Monique Myers got a glimpse of that future for some California beaches. El Niño occurs when part of the tropical Pacific Ocean warms and expands, causing water levels to rise. "We had five to six inches of sea-level rise, but it just occurred over a few month period of time in 2015 to 2016. . . Many of these bluff-backed and armored beaches just didn't have any dry sand. You couldn't go to the beach anymore," Myers said.
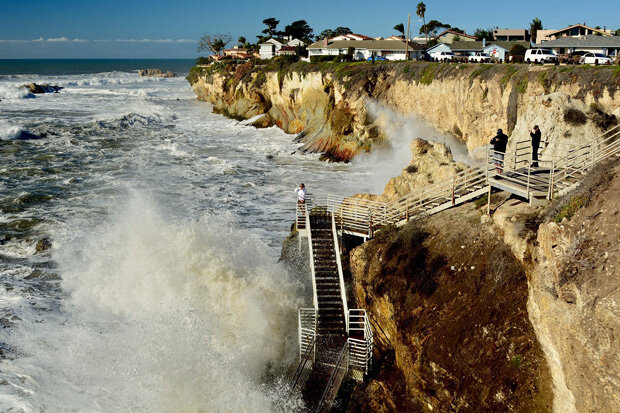
Tucked up against cliffs and bluffs, many of California's narrow, sandy beaches could disappear in the coming century due to sea level rise. The higher-than-average water levels associated with the 2015-16 El Niño gave communities like Shell Beach, pictured here on December 12, 2015, a glimpse of their possible future. Photo by Harold Litwilder, used under a CC license.
Without data from the beach profile monitoring volunteers, researchers would be left with a handful of pages of the book of coastal change, piecing together fragments. To understand the effects of climate change, complete and holistic data is critical. The beach profiling volunteers help staff the front lines.
“I am filled with awe and gratitude that we have a large group of volunteers that are willing to give of their time and energy to collect data regularly, on packed beaches in the summer and in negative temperatures and gale force winds in the winter,” said New Hampshire Sea Grant’s Eberhardt.
“Volunteers are amazing. I am honored to have the good fortune to work with our community scientists.”