U.S. climate summary for June 2024
June temperature highlights
Grab and drag slider to compare average temperature for June 2024 (left) to what's normal for June (right) based on data from 1991-2020. Places where the May average was cooler than 50 degrees Fahrenheit—only the high mountains of the West—are colored blue; places where it was warmer than 50 degrees are colored yellow, orange, and red. NOAA Climate.gov maps from our Data Snapshots: Temperature collection, based on data from NCEI.
June temperatures were above average to record warm across much of the contiguous U.S. Arizona and New Mexico each had their warmest June on record with 18 additional states ranking among their top 10 warmest Junes on record.
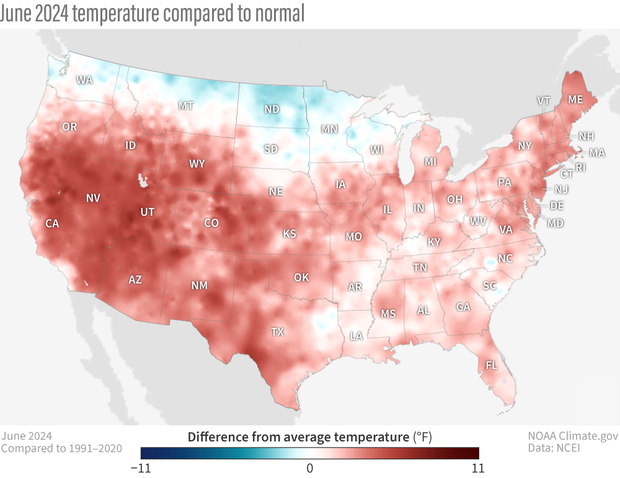
Average temperature in June 2024 compared to normal (1991-2020 average). Places that were warmer than average are red; places that were cooler than average are blue. Nearly the entire contiguous United States was warmer than average. NOAA Climate.gov maps from our Data Snapshots: Temperature collection, based on data from NCEI.
The Alaska statewide June temperature was 52.8°F, 3.6°F above the long-term average, ranking sixth warmest in the 100-year period of record for the state. Above-average temperatures were observed throughout most of the state, with near-average temperatures observed across much of the Aleutians and South Panhandle.
For the January–June period, the average contiguous U.S. temperature was 50.9°F, 3.4°F above average, ranking second warmest on record for this period. Temperatures were above average across nearly all of the contiguous U.S., while record-warm temperatures were observed in parts of the Northeast, Great Lakes, southern Plains and Mid-Atlantic. New Hampshire, Vermont, Pennsylvania and West Virginia each saw their warmest January–June period. An additional 24 states had a top-five warmest year-to-date period. No state experienced a top-10 coldest event during this six-month period.
Precipitation highlights
Grab and drag slider to compare total precipitation (rain and snow) for June 2024 (left) to what's normal for June based on data from 1991-2020 (right). Places where the June precipitation was less than 4 inches are colored light to medium green; places where it was more than 4 inches are colored light to dark blue. NOAA Climate.gov maps from our Data Snapshots: Precipitation collection, based on data from NCEI.
June precipitation for the contiguous U.S. was 2.74 inches, 0.18 inch below average, ranking in the driest third of the historical record. Precipitation was below average across much of the Southeast, Mid-Atlantic and Ohio Valley and across portions of the Plains and California to the Northern Rockies. Portions of the Southeast experienced dry soils, low streamflow and distressed crops in June.
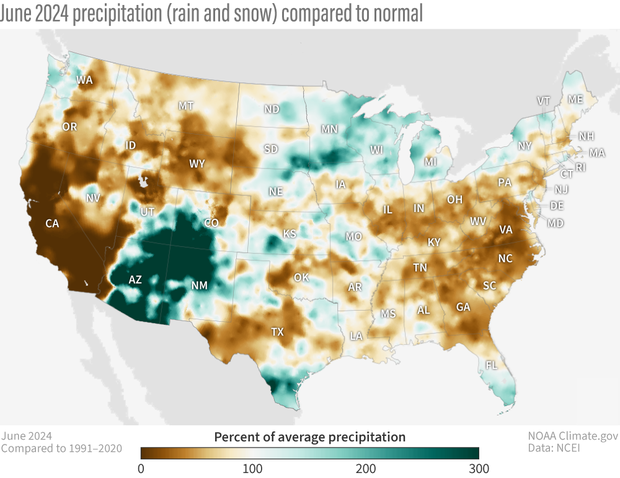
This map shows June 2024 precipitation (total rain and snow) received across the United States as percent of normal (1991-2020 average). Note that parts of the Southwest receive very little precipitation in June on average, so even a little less or more than usual precipitation can look like a very large surplus or deficit. NOAA Climate.gov map from our Data Snapshots: Precipitation collection, based on data from NCEI.
Virginia had its driest June on record and North Carolina had its second driest June. Conversely, precipitation was above average across much of the Upper Midwest and Southwest and in portions of the Northeast, Plains and southern Florida. Minnesota had its fourth wettest June, while Wisconsin had its sixth wettest.
Alaska’s average monthly precipitation ranked fifth driest in the historical record. Much of the state was drier than average for the month of June, while near-average precipitation was observed in the North Slope region.
The January–June precipitation total for the contiguous U.S. was 17.36 inches, 2.06 inches above average, ranking 11th wettest in the 130-year record. Precipitation was above average across a large portion of the Upper Midwest, Northeast and Deep South as well as in pockets across much of the contiguous U.S., with Rhode Island having its second-wettest year-to-date period on record and Minnesota and Wisconsin ranking third wettest. Conversely, precipitation was below average across parts of the Northwest, northern Plains, west Texas and eastern North Carolina during the January–June period.
The January–June precipitation for Alaska ranked in the middle third of the 100-year record, with below-average precipitation observed across parts of the Central Interior, Cook Inlet, Northeast Interior and South Panhandle regions, near-average precipitation in the Aleutians, Northwest Gulf, Northeast Gulf and North Panhandle and above-average precipitation observed across the remaining climate divisions.
Billion-Dollar Disasters
Four new billion-dollar weather and climate disasters were confirmed in June 2024, including two hail events that impacted Texas and Colorado at the end of April and end of May, respectively, one severe weather event that impacted the central, southern and eastern U.S. in mid-May and a tornado outbreak that impacted portions of the Central U.S. in mid-May.
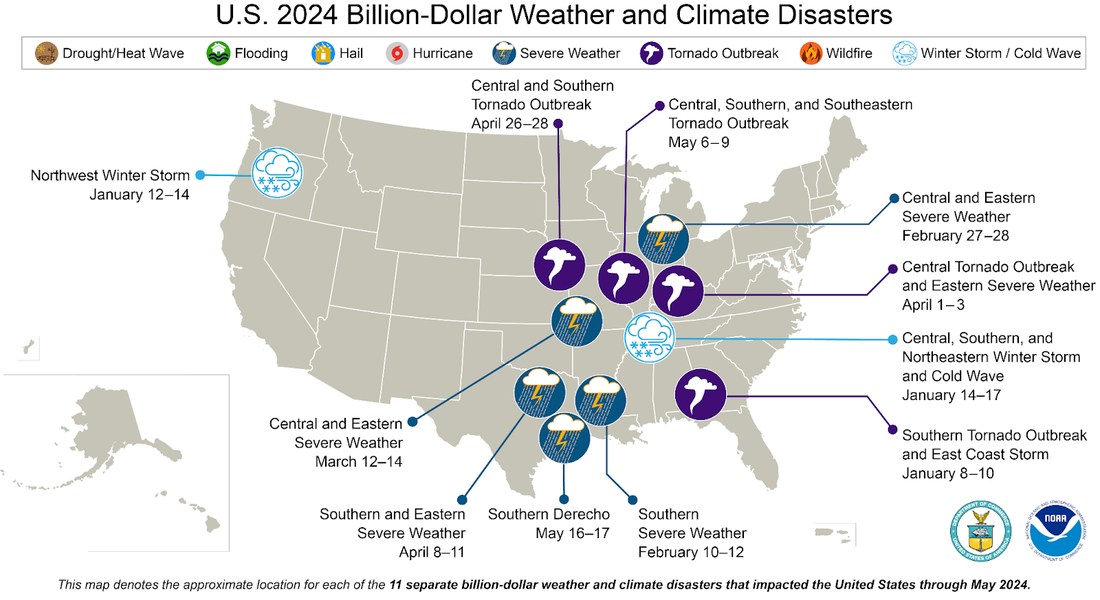
The location and type of billion-dollar disasters so far in 2024. NOAA NCEI map.
There have been 15 confirmed weather and climate disaster events this year, each with losses exceeding $1 billion. These disasters consisted of 13 severe storm events and two winter storms. The total cost of these events exceeds $37 billion, and they have resulted in at least 101 fatalities.
The U.S. has sustained 391 separate weather and climate disasters since 1980 where overall damages/costs reached or exceeded $1 billion (including CPI adjustment to 2024). The total cost of these 391 events exceeds $2.755 trillion.
Other Notable Events
- The Correll Fire, which started on June 1 in San Joaquin County, CA burned over 14,000 acres.
- The Darlene 3 Fire, which started on June 25 in Deschutes County, OR burned over 3,800 acres, prompted emergency evacuations and left thousands without power.
- On June 2, an extreme rotating thunderstorm dropped cantaloupe-size (>6.25 inches in diameter) hail in the Texas Panhandle—this could be the new state record for largest hail diameter.
- A series of heat waves brought record-breaking temperatures to portions of the U.S. during June:
- The National Weather Service office in Caribou, Maine, issued its first-ever Excessive Heat Warning due to “feels-like” temperatures getting close to 110 degrees on June 19.
- For the first time on record, the entire island of Puerto Rico and the U.S. Virgin Islands were placed under a heat advisory or warning by the National Weather Service on June 24.
- Alberto, the first named storm of the 2024 Atlantic hurricane season, made landfall in Mexico on June 20 as a tropical storm.
- Some Texas communities saw nearly three times their June average for rainfall over 48 hours from Tropical Storm Alberto, including the Gulf Coast-area city of Rockport, Texas, which received 9.97 inches of rain from the storm; its June average is 3.66 inches. Similarly, Alice, Texas, received 6.57 inches of rain—nearly triple its June average of 2.32 inches.
Drought
According to the July 2 U.S. Drought Monitor report, about 19% of the contiguous U.S. was in drought, up about 6% from the end of May. Drought conditions expanded or intensified across most of the Southeast, much of the Mid-Atlantic and portions of the Ohio Valley, Tennessee, eastern Oklahoma and northern Plains this month. Drought contracted or was reduced in intensity across much of the Southwest, Kansas, the panhandle of Oklahoma, southern Texas and southern Florida.
Grab and drag slider to compare drought conditions in early July (left) to the end of May (right). The U.S. area affected by drought increased significantly in the East over the month of June. NOAA Climate.gov maps from our Data Snapshots: Drought collection, based on data provided by the U.S. Drought Monitor project. For more information on drought conditions, visit Drought.gov.
Monthly Outlook
Above-average temperatures are favored to impact areas across the western and southern portions of the U.S. in July, while below-average precipitation is likely to occur in the Northwest and south-central Plains. Drought is likely to persist in the Mid-Atlantic, Southwest, Northwest and Hawaii. See our post covering the July 2024 monthly outlook, which are based on the Climate Prediction Center’s Official 30-Day Forecasts and U.S. Monthly Drought Outlook.
Significant wildland fire potential for July is above normal across portions of the Mid-Atlantic, West, Hawaii and Alaska. For additional information on wildland fire potential, visit the National Interagency Fire Center’s One-Month Wildland Fire Outlook.
This monthly summary from NOAA’s National Centers for Environmental Information is part of the suite of climate services NOAA provides to government, business, academia and the public to support informed decision-making. For more detailed climate information, check out our comprehensive June 2024 U.S. Climate Report scheduled for release on July 12, 2024. For additional information on the statistics provided here, visit the Climate at a Glance and National Maps webpages.